The Energy Consulting Group
Management consultants for upstream oil and gas producers and service companies
|
E&P News and Information Scandinavian International and National International Energy
Agency Department of Trade and Norwegian
Petroleum Ministry of Industry
and E&P Project Information |
|---|
Economics of North American Oil and Gas Shale Plays
Discussion of the Main
Economic Drivers of North American shale gas and light, tight oil
plays
Samples of Output From
Economic Valuation Asset Lens (EVAL), an oil and gas evaluation program
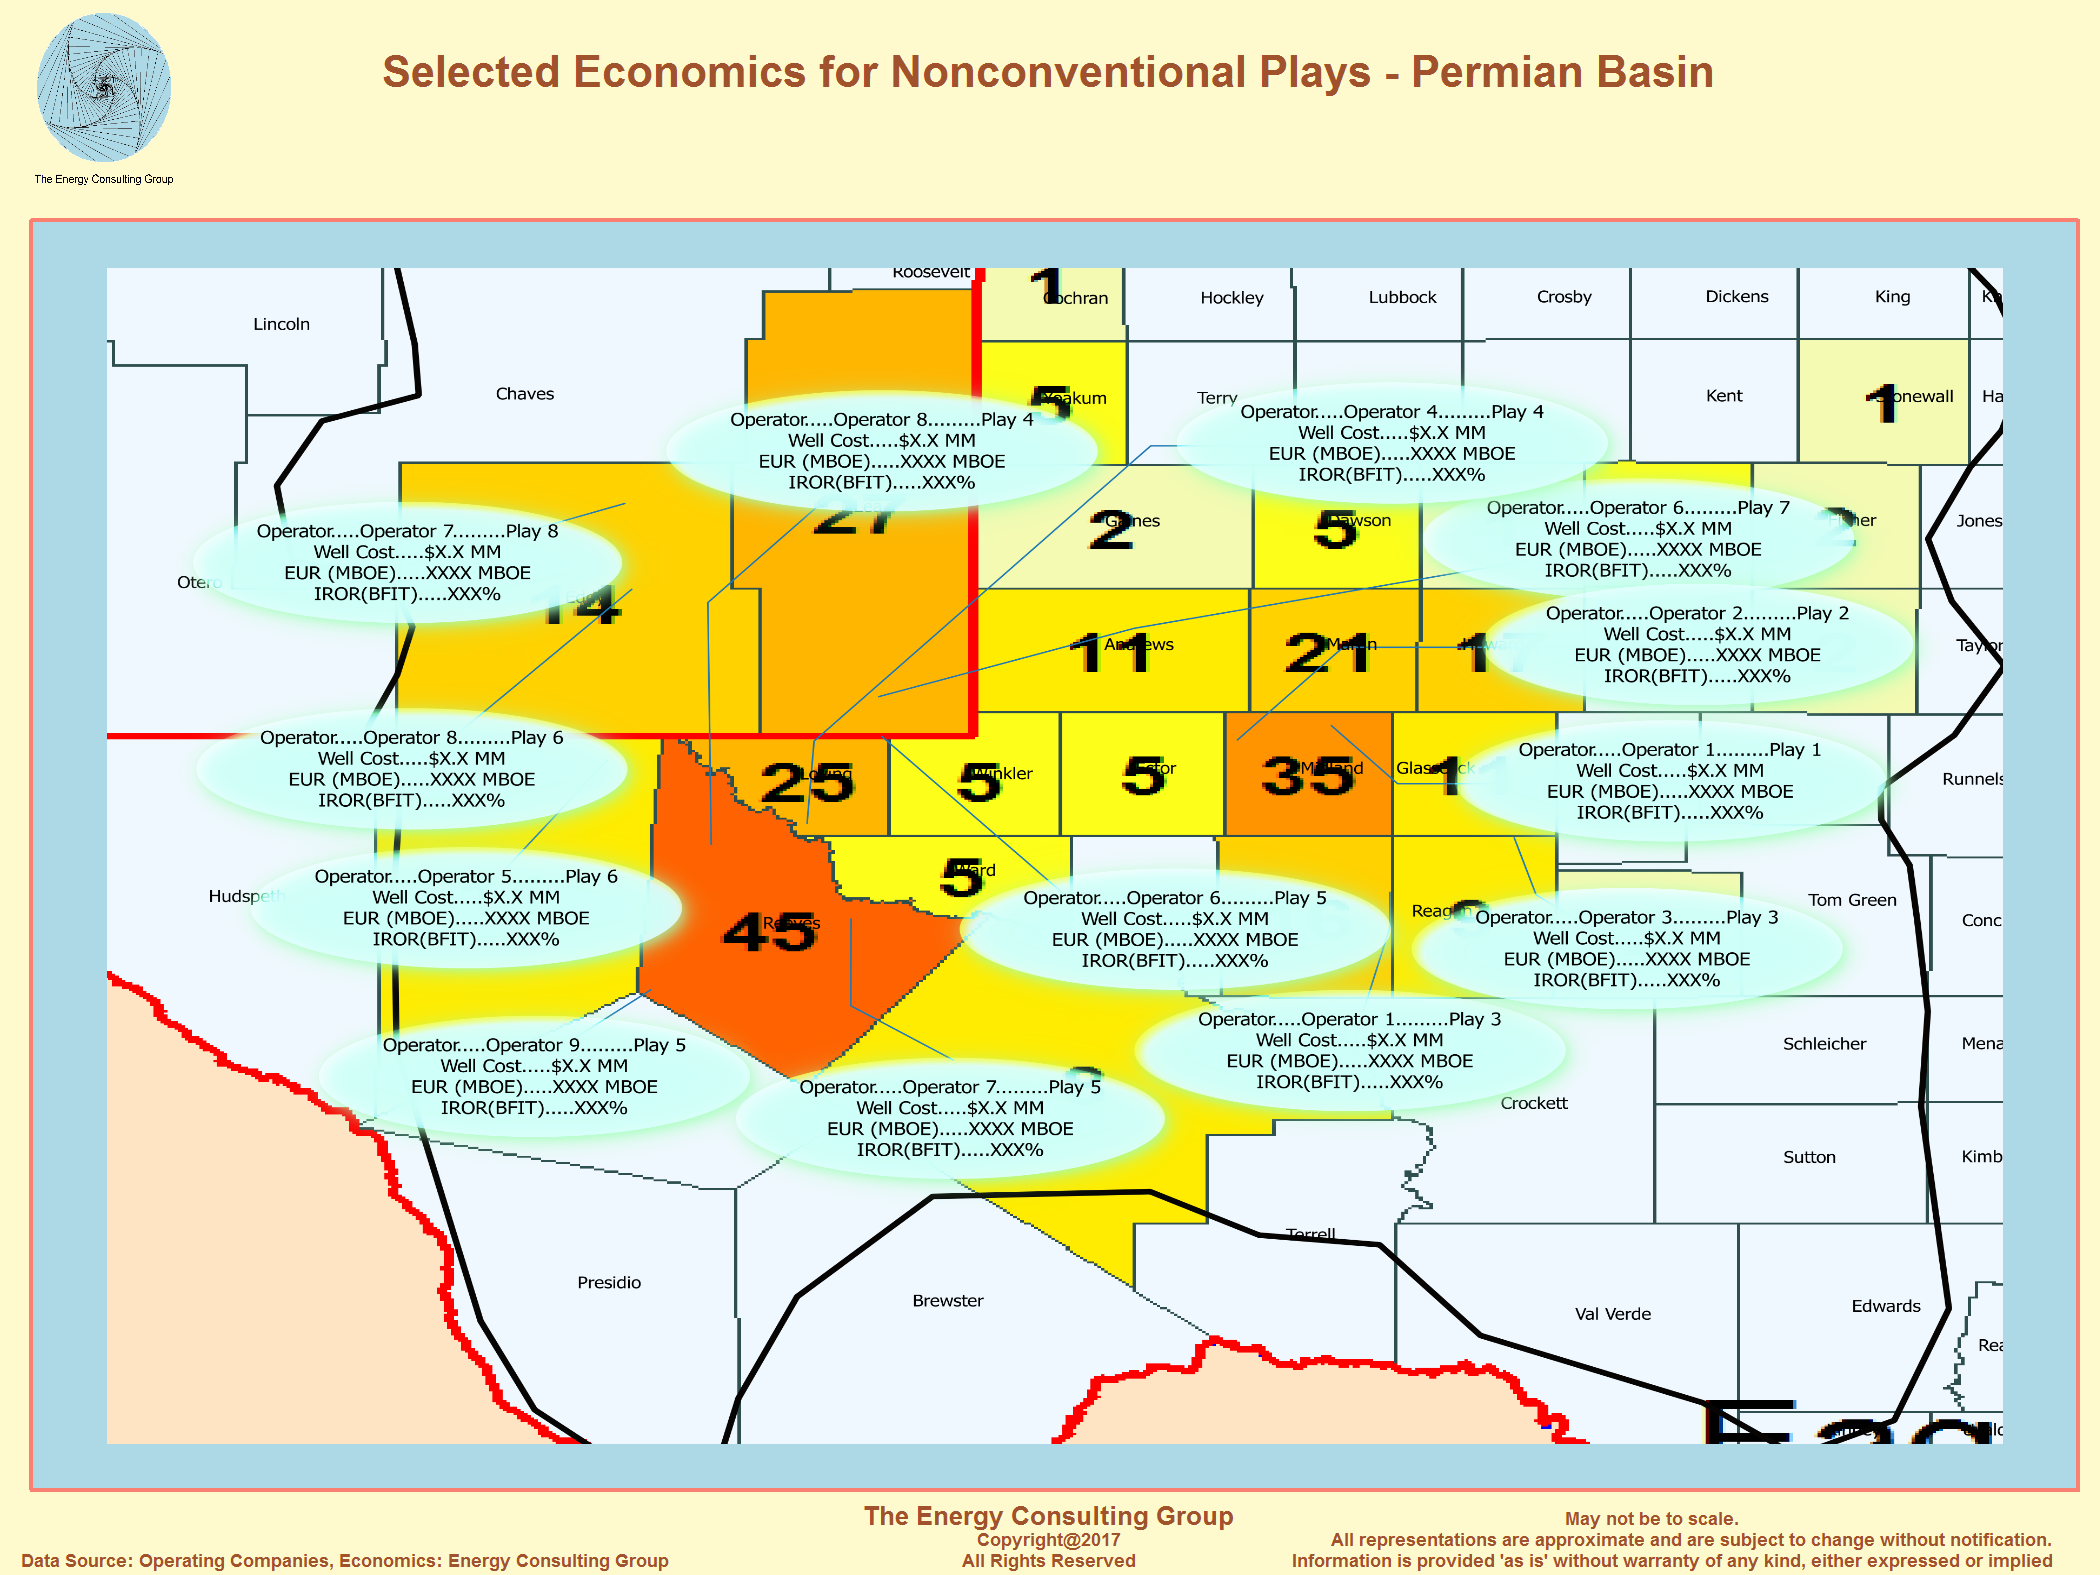
With the dramatic fall in oil prices after the failed March 6, 2020 OPEC+ meeting, we have been busy assessing which parts of the shale oil industry are still economically viable, and which parts will be best positioned for growth on the other side of this downturn. We do this using a variety of tools, but one of the most useful is to perform sensitivities of ROR's to changes in the oil price. The two most relevant such analyses are: 1) ROR sensitivity of new well developments (drill, complete, and equip) in several different shale oil plays to oil prices (presented here); and 2) ROR sensitivity to oil prices of DUC development (complete and equip) in those same shale oil plays (presented here). In this context DUC stands for Drilled, UnCompleted. The logic is that the industry has built up a substantial inventory of wells that have been drilled but not completed, and, therefore, can be brought on production for considerably less CAPEX than a completely new well would cost. This is sound logic, but we pressure test the concept by actually running the economics, which turns up some flaws in the reasoning. As we perform these sensitivities, we are also mapping out which of the companies that specialize in shale oil development (both producers and service firms) are most likely to whether the storm grinding across the oil patch. This is one such map we pulled together in 2017 as we evaluated the Permian shale landscape as it emerged from the last big industry turn down in 2016. For this assessment, we not only use economics, but also our access to detailed drilling and stimulation reports for many different companies that tell us specifically how each producer is drilling and fracking a well, how much those activities cost, and which service firms are performing the work (sample drilling and stimulation reports presented here). We also use the production data for these same wells to determine relative effectiveness of each firm's drilling procedures and completion designs. In short, we believe this analytical approach gives us excellent insight as to which firms in the shale complex will be able to weather the storm.
Note: all the production profiles and economics presented below come from our proprietary EVAL program (Economic Valuation Assessment Lens) . This is the economic analysis program we developed at the Energy Consulting Group (ECG). It is flexible, accuracte and easy-to-use, and, therefore, invaluable for understanding the economics of the oil and gas industry. Because of the nature of most of our work, it has been tuned specifically with unconventional assets in mind. One of the ways we've done this is to integrate EVAL with the popular R statistical program. Some in the industry call or have called shale gas and/or light tight oil plays "statistical" plays. We don't disagree, which is why we have matched up standard industry approaches for production and economic modeling, with the statistical, stochastic modeling capabilities of R. Some results of this integration are presented in the following section as R-Exhibits A-D. We are now using our R statistical modeling expertise to incorporate auto machine learning (AutoML) capabilities into our analytical tool suite, including integration with EVAL. Based on our experience so far, we believe the machine learning tools to be especially differentiating for oil and gas asset valuation, and oil and gas reserve quantification/classification.
We have intentionally left off axis labels and certain other information in many of the exhibits presented on this page. If you are interested in obtaining the fully annotated versions, please contact us at insight@energy-cg.com.
Where are the shale gas and light, tight oil plays under discussion?
The following index map presents many of the more prominent North American plays.
|
Exhibit 1: Map of Selected USA and Canadian Light Tight Oil and Shale Gas Plays 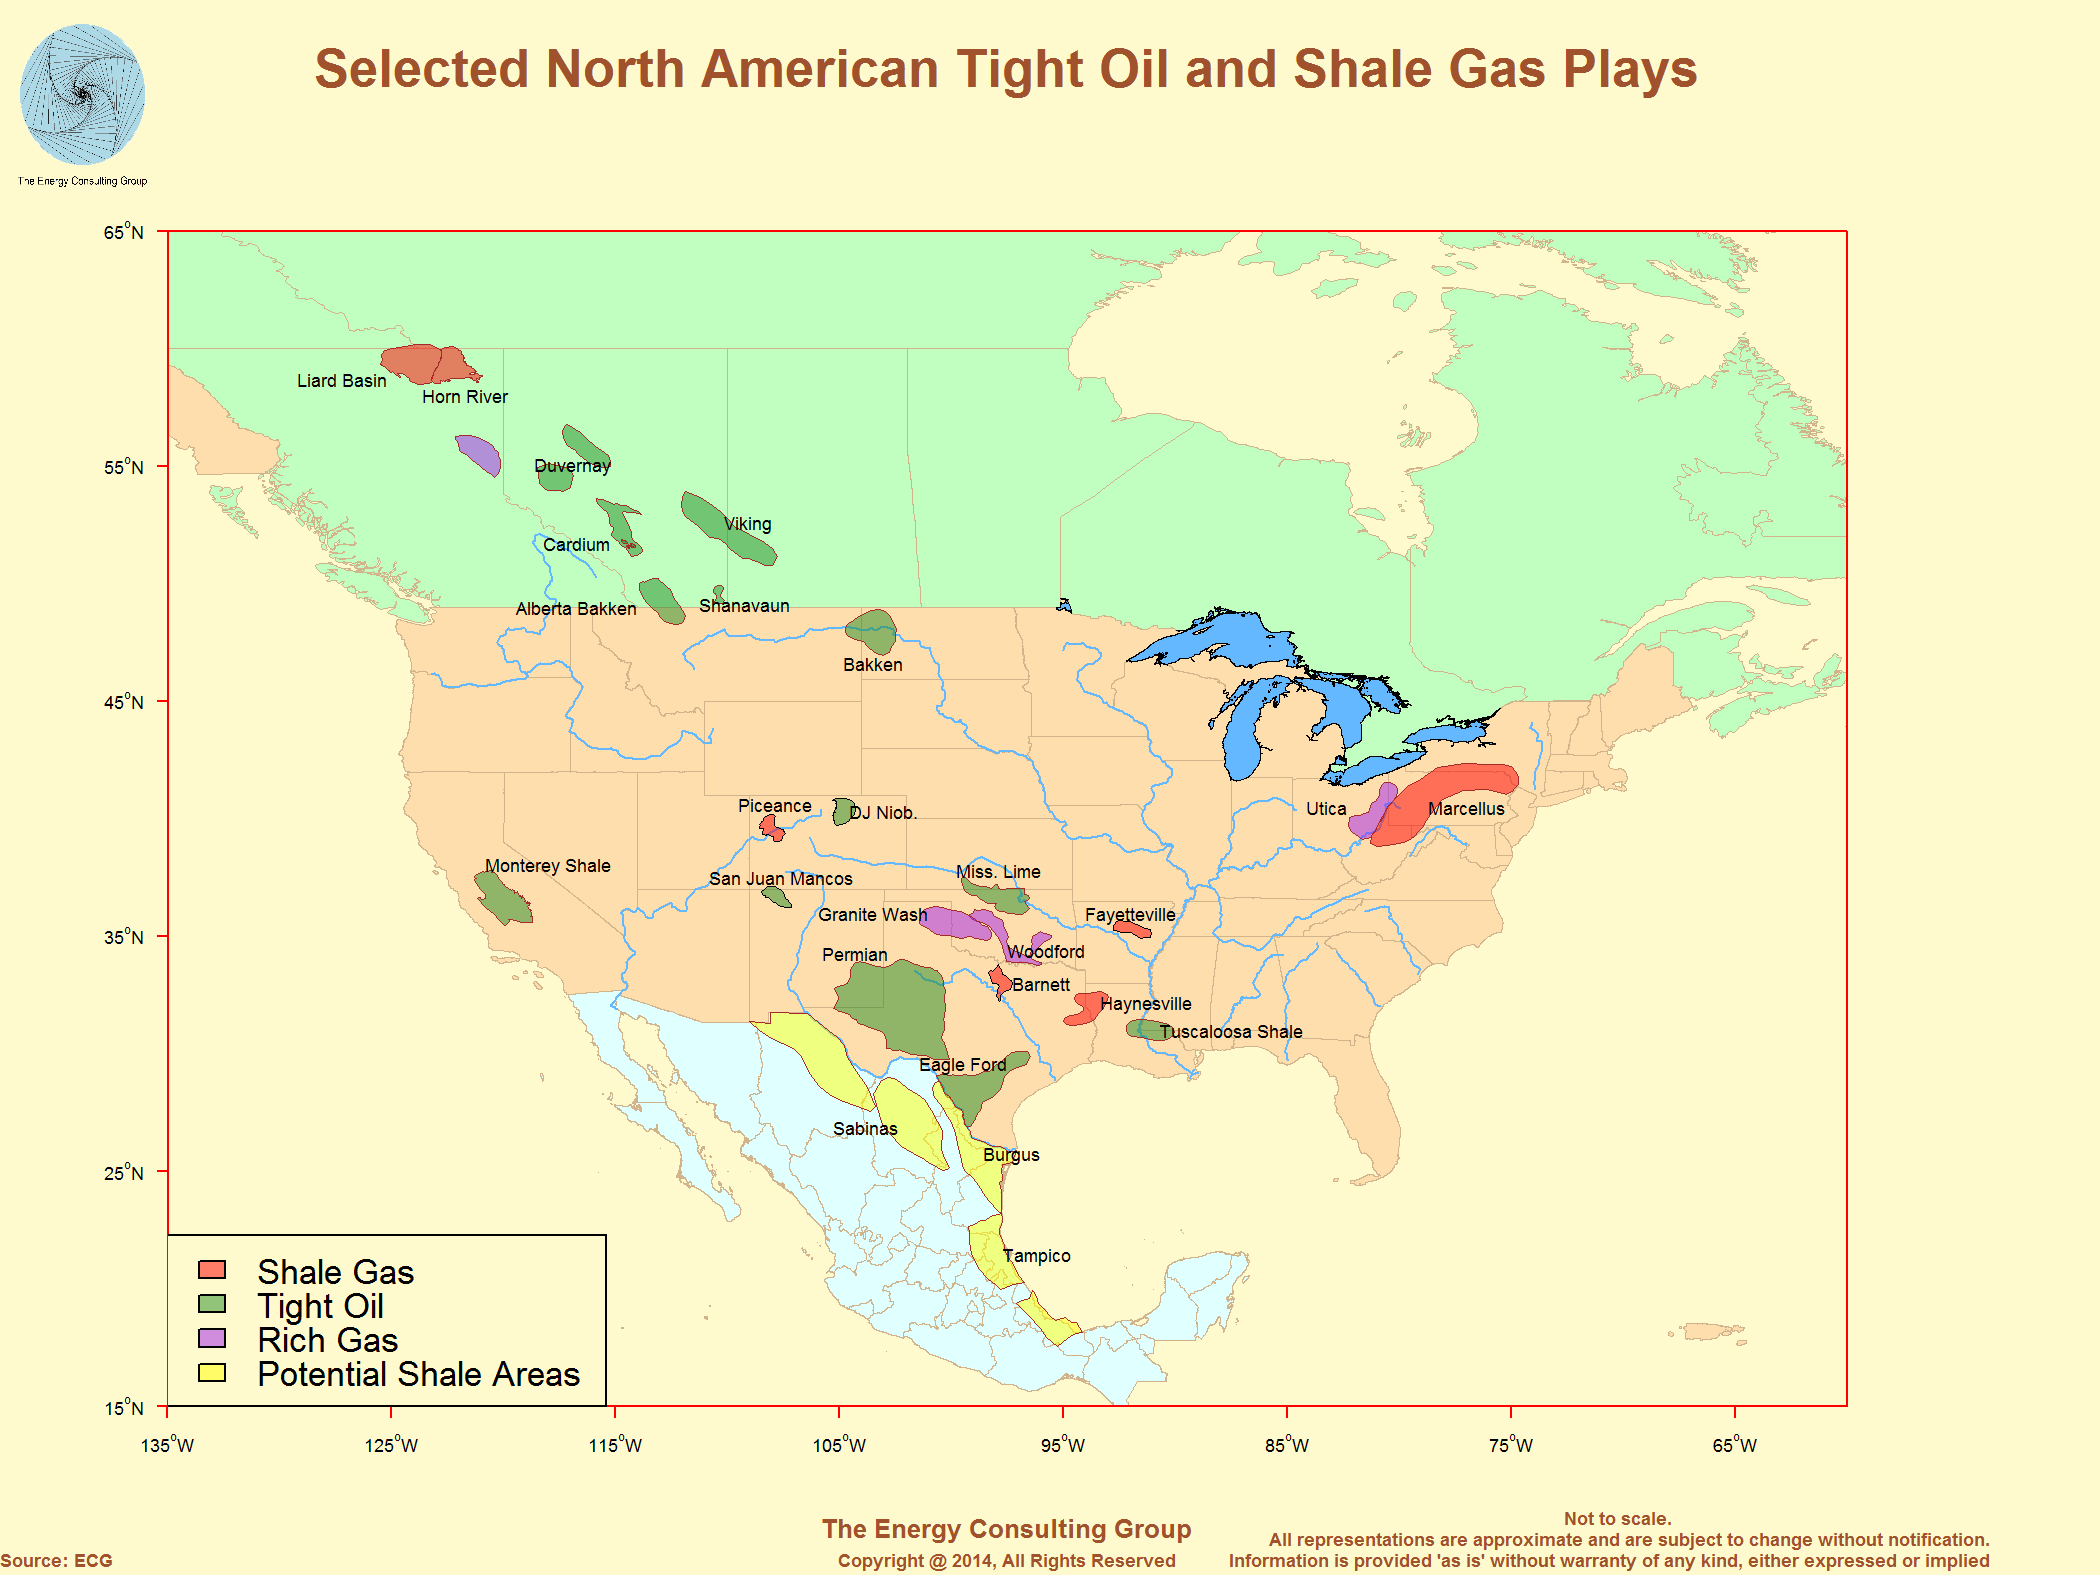 Click for Full Size Image |
Economic Sensitivity of Drilled Uncompleted
Wells (DUC's) for Selected Elements of LTO Plays to Different Realized
Oil Prices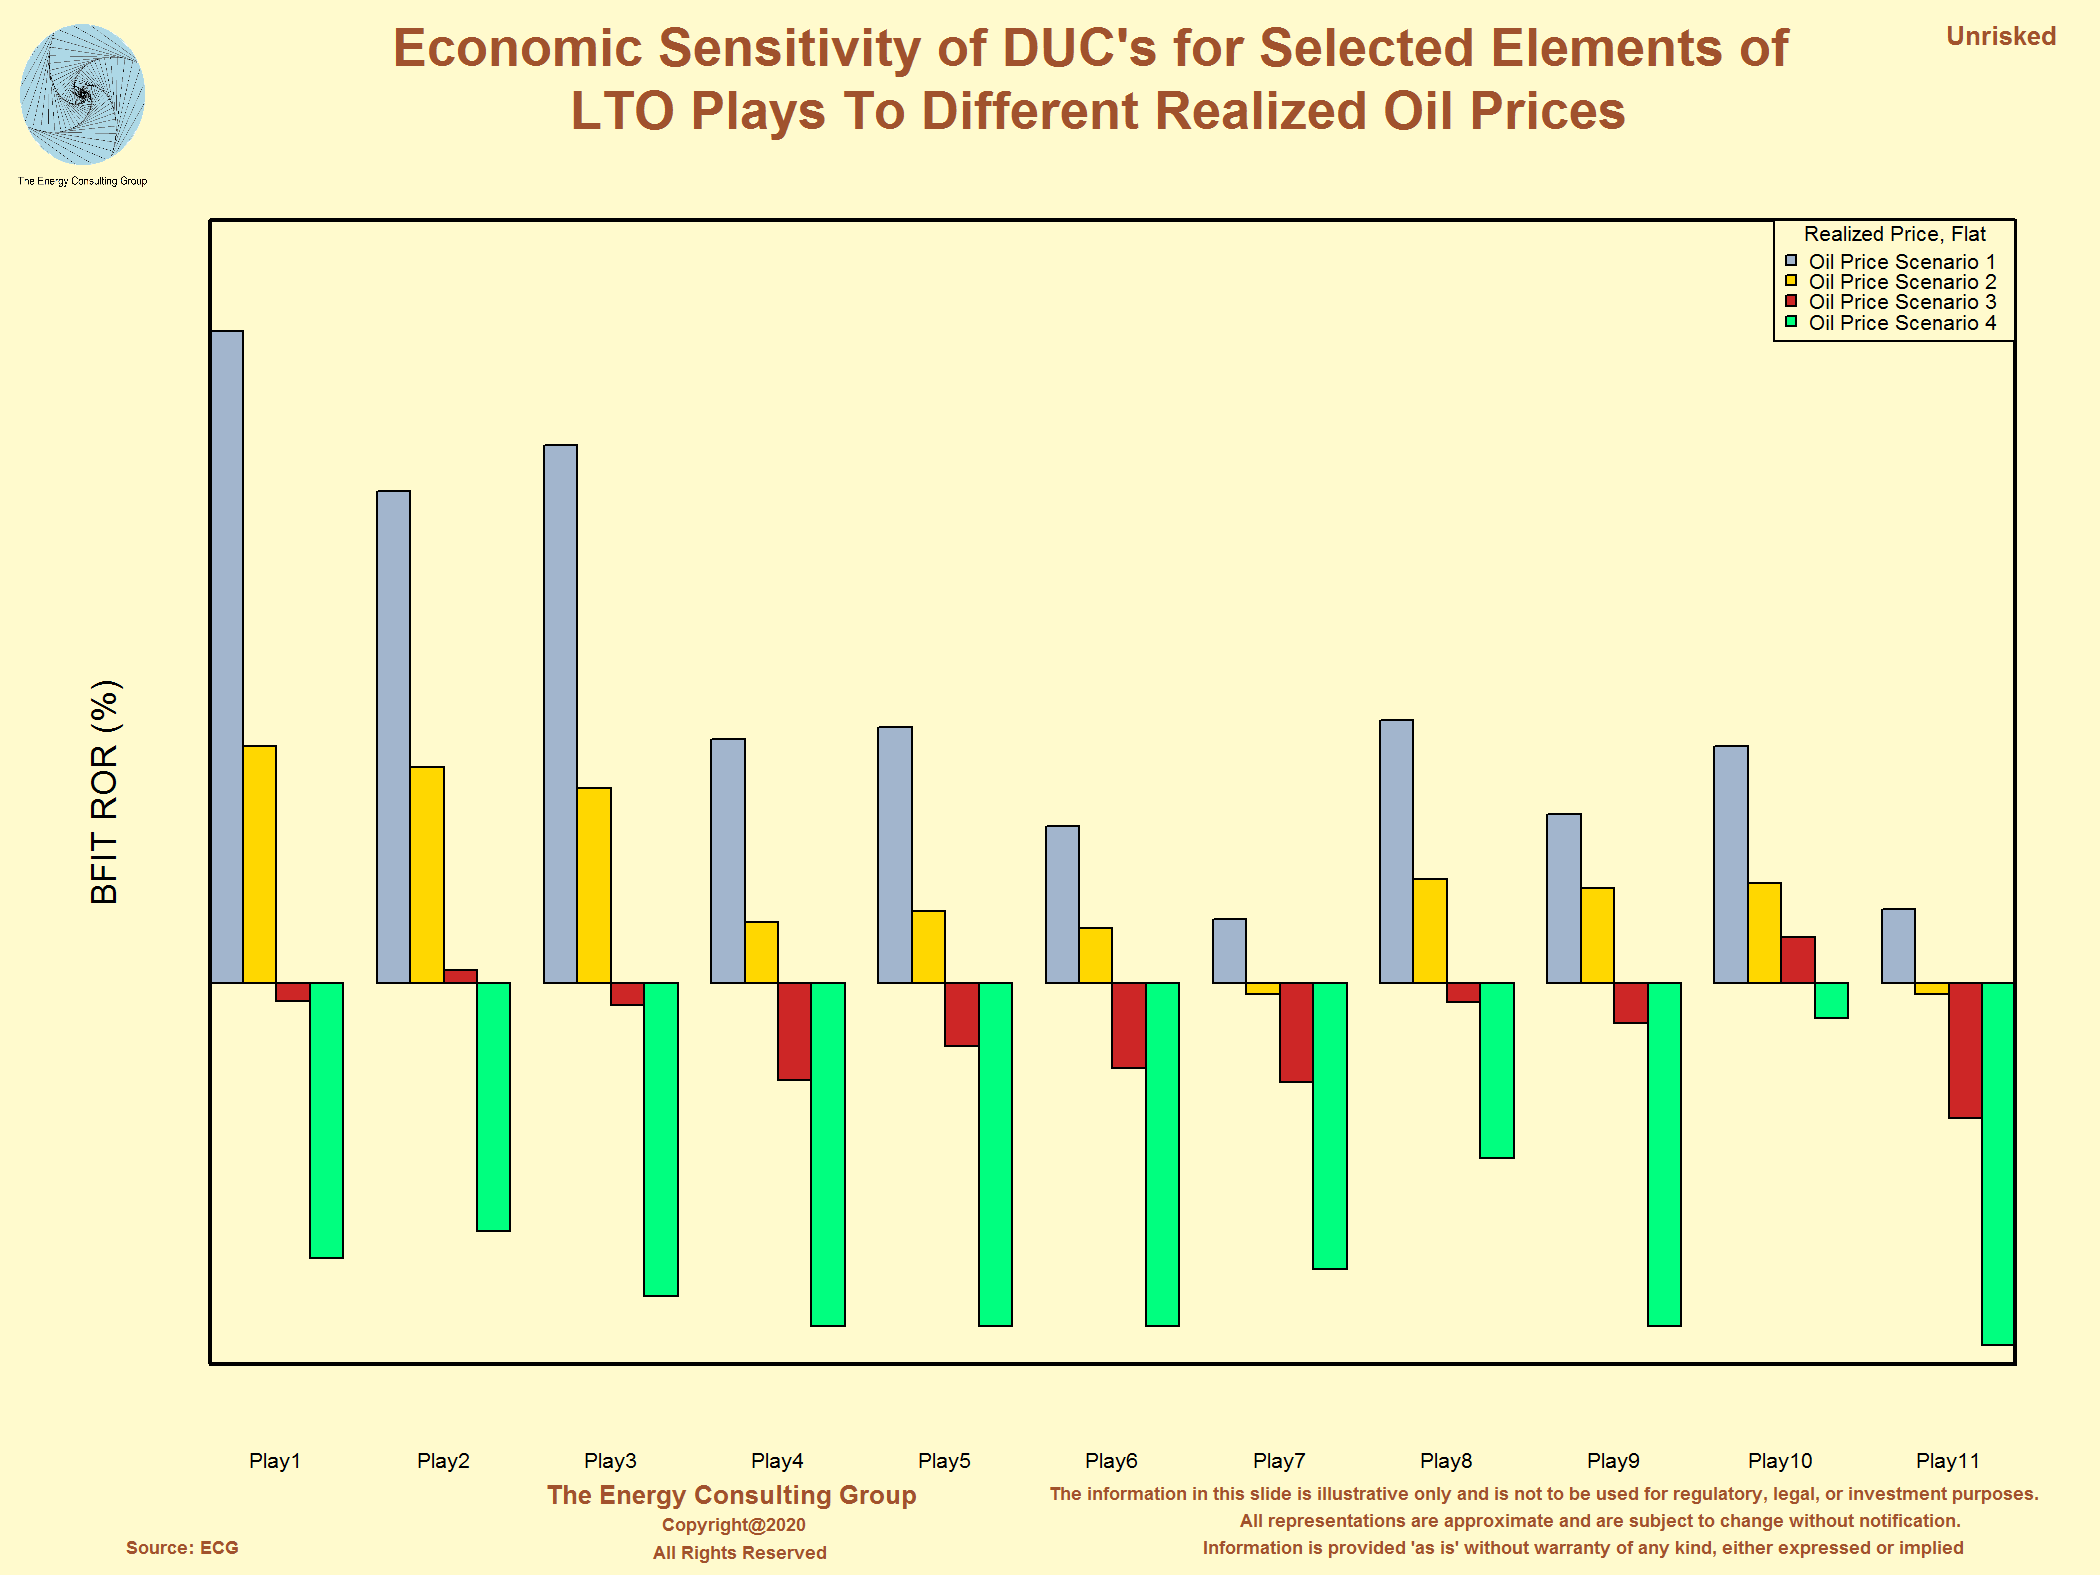 Click for Full Size Image |
Discussion of the Main Economic Considerations For North American shale gas and light, tight oil plays
High Rates, High Declines, and High Costs
To map out the full potential of the shale revolution, we have to understand the economics of the plays, and how those economics relate to other plays. To that end, the first thing to appreciate is that the drivers of shale play economics in North America differ significantly from historical onshore NA plays in that they tend to be more prolific, sometimes spectacularly so:
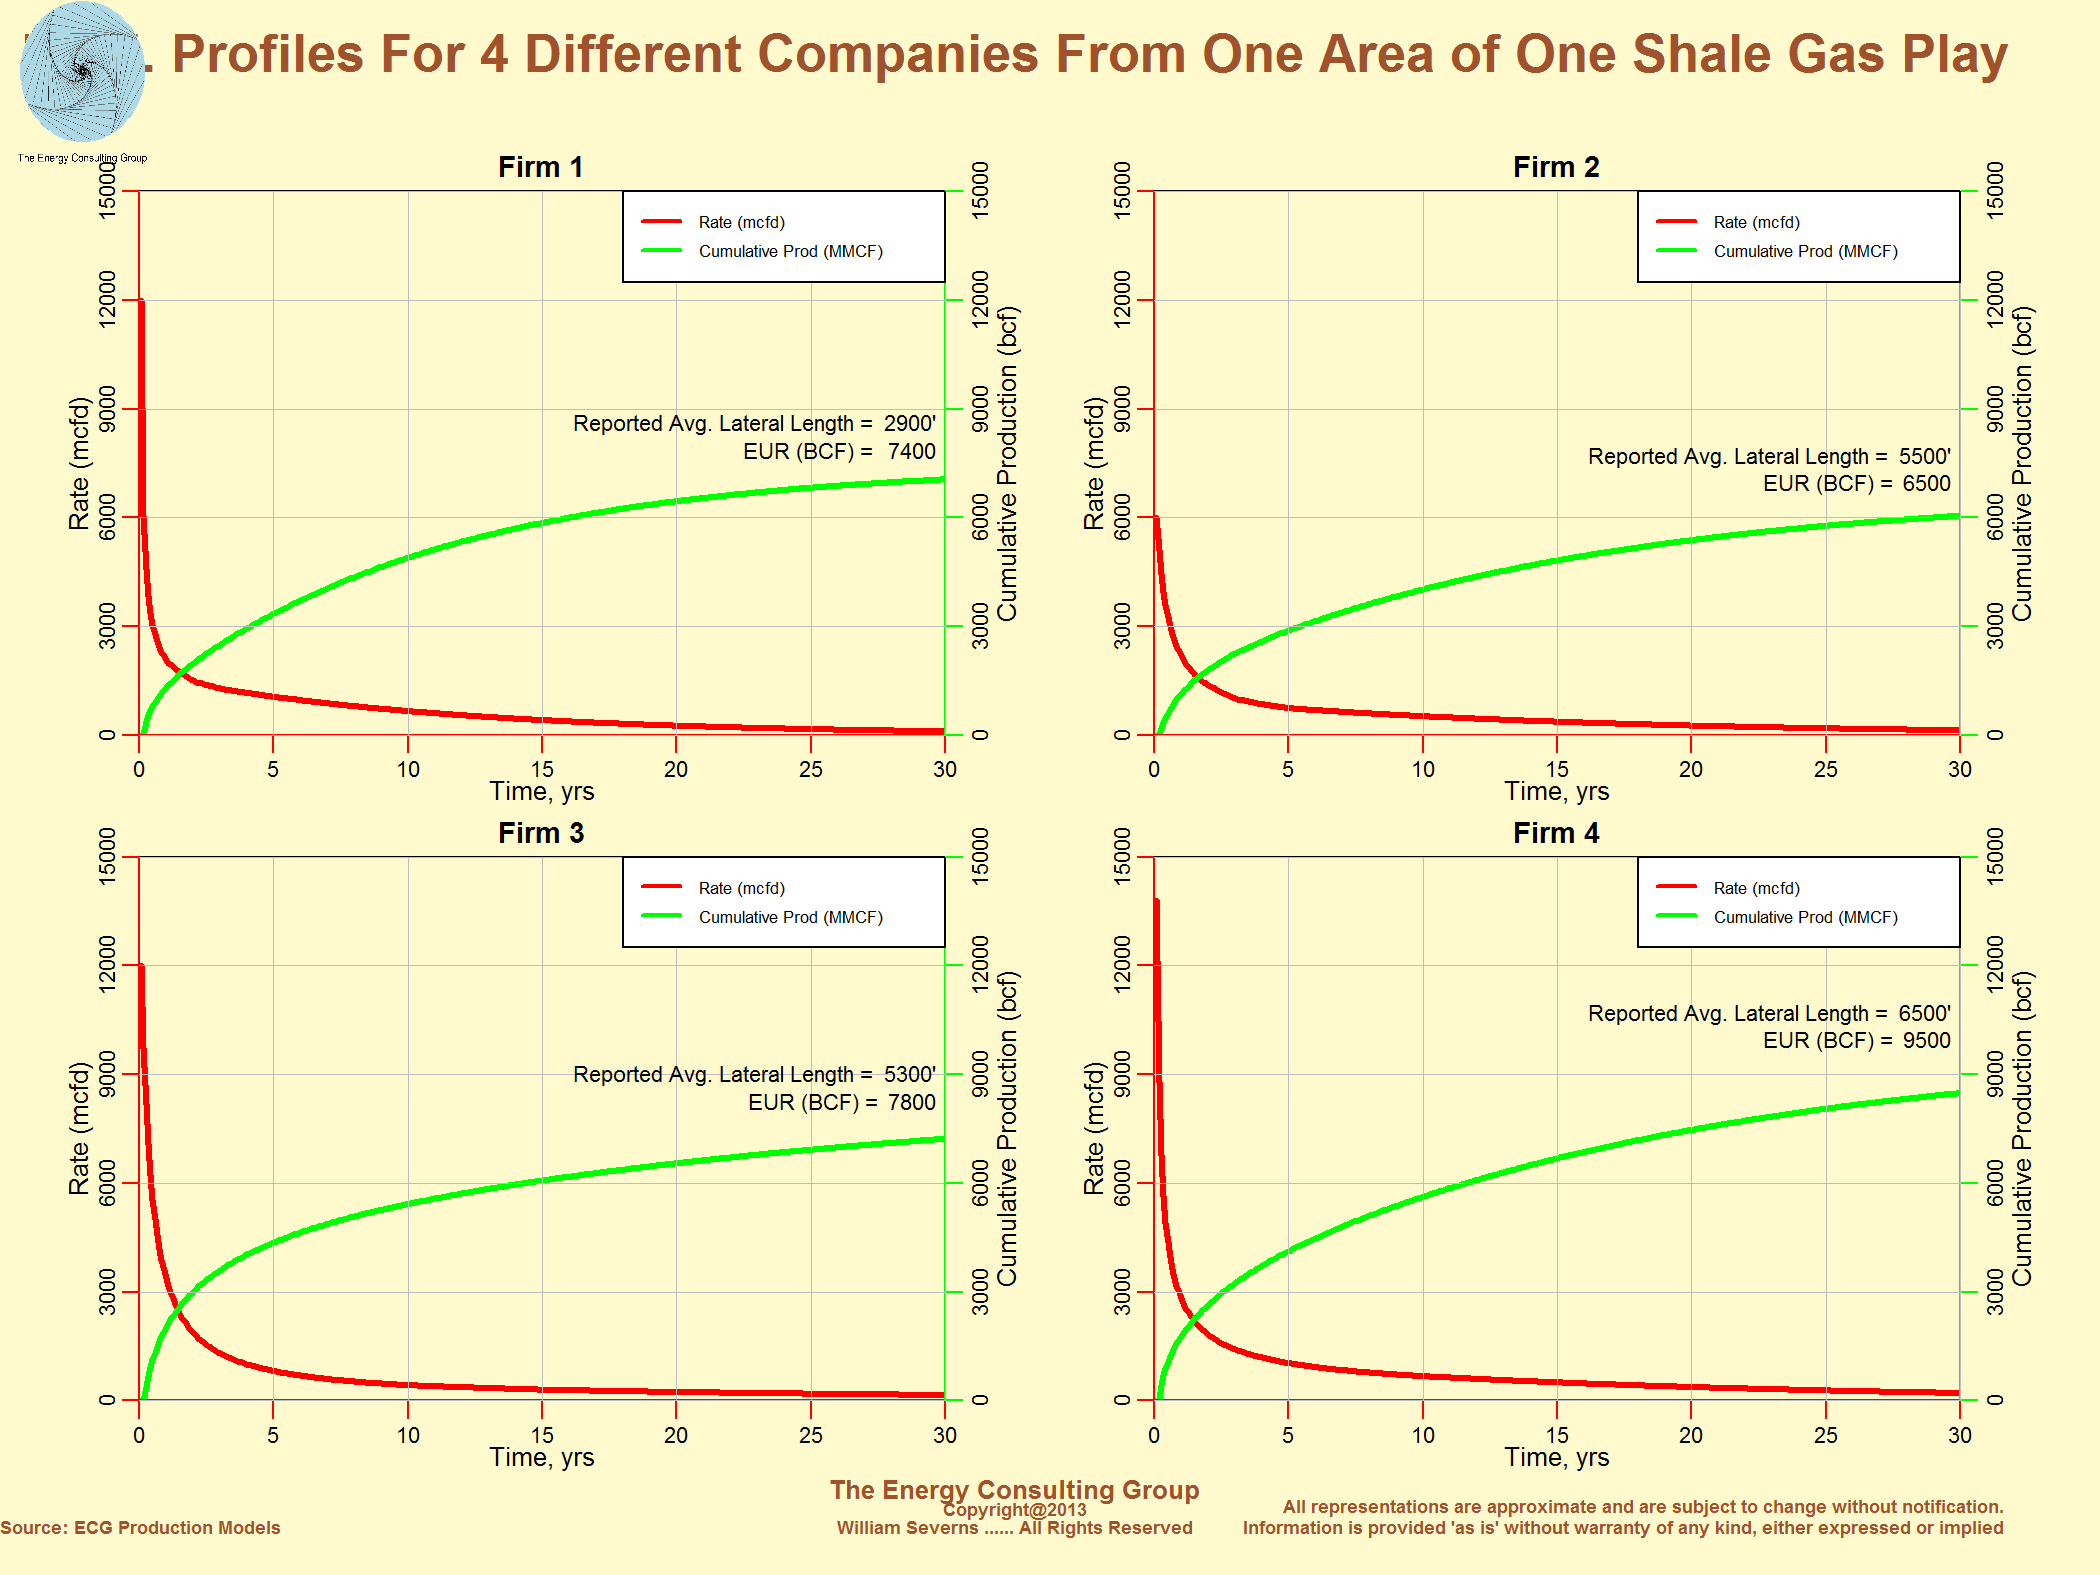
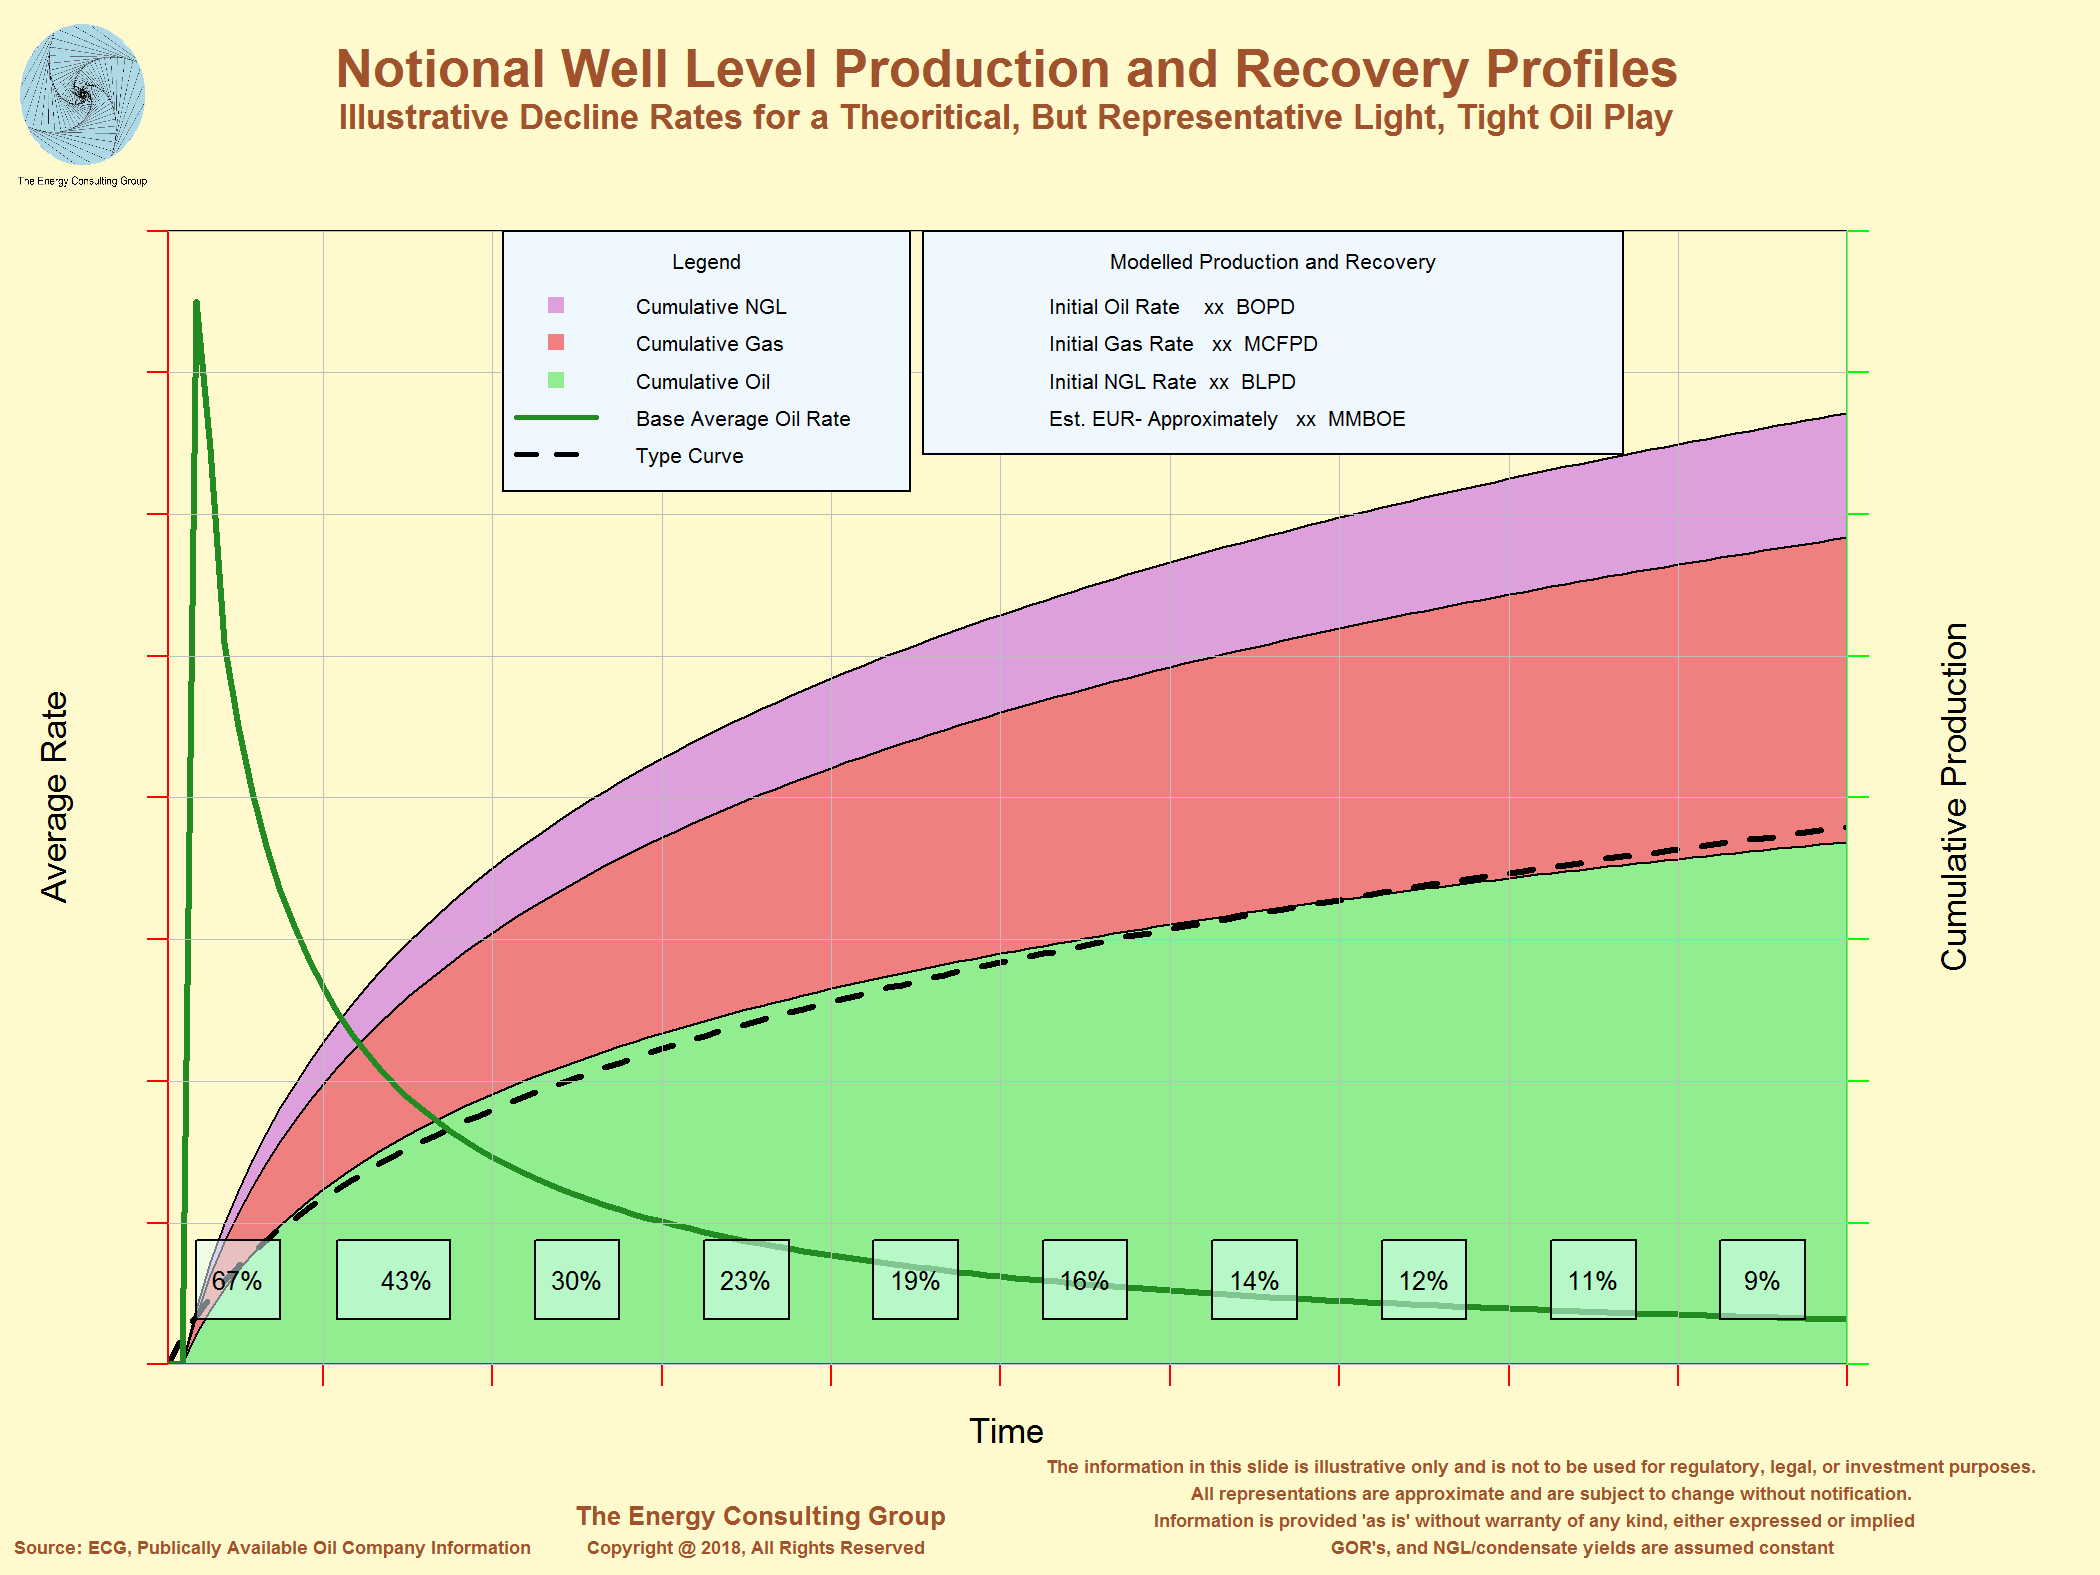
Prolific Initial Rates: The key attribute that makes the shale plays economically viable are "high" initial rates compared to the previous generation of unconventional wells, such as those in tight gas plays. These rates can lead to sufficient oil and gas volumes during the economically critical first four years of production to make the business case for drilling shale gas and light, tight oil wells, though other factors such as oil and gas prices, well costs, etc. also factor into the economic results. The associated rates of return can be spectacular. Our extensive work with the shales demonstrates that before tax ROR's can exceed 100%, depending on the specific circumstances, especially oil and gas prices. Now, not every play, nor every well delivers such performance. However, it happens with sufficient frequency for the shales to attract investors. So, while the initial decline rates can apporach 70%-80% over the first year of production (discussed next), high starting rates in successful wells can more than compensate.
| R_Exhibit A Production Profile for One Specific Unconventional Well (not generally applicable) |
R_Exhibit B Unconventional USA Oil Play Initial Rate (not generally applicable) 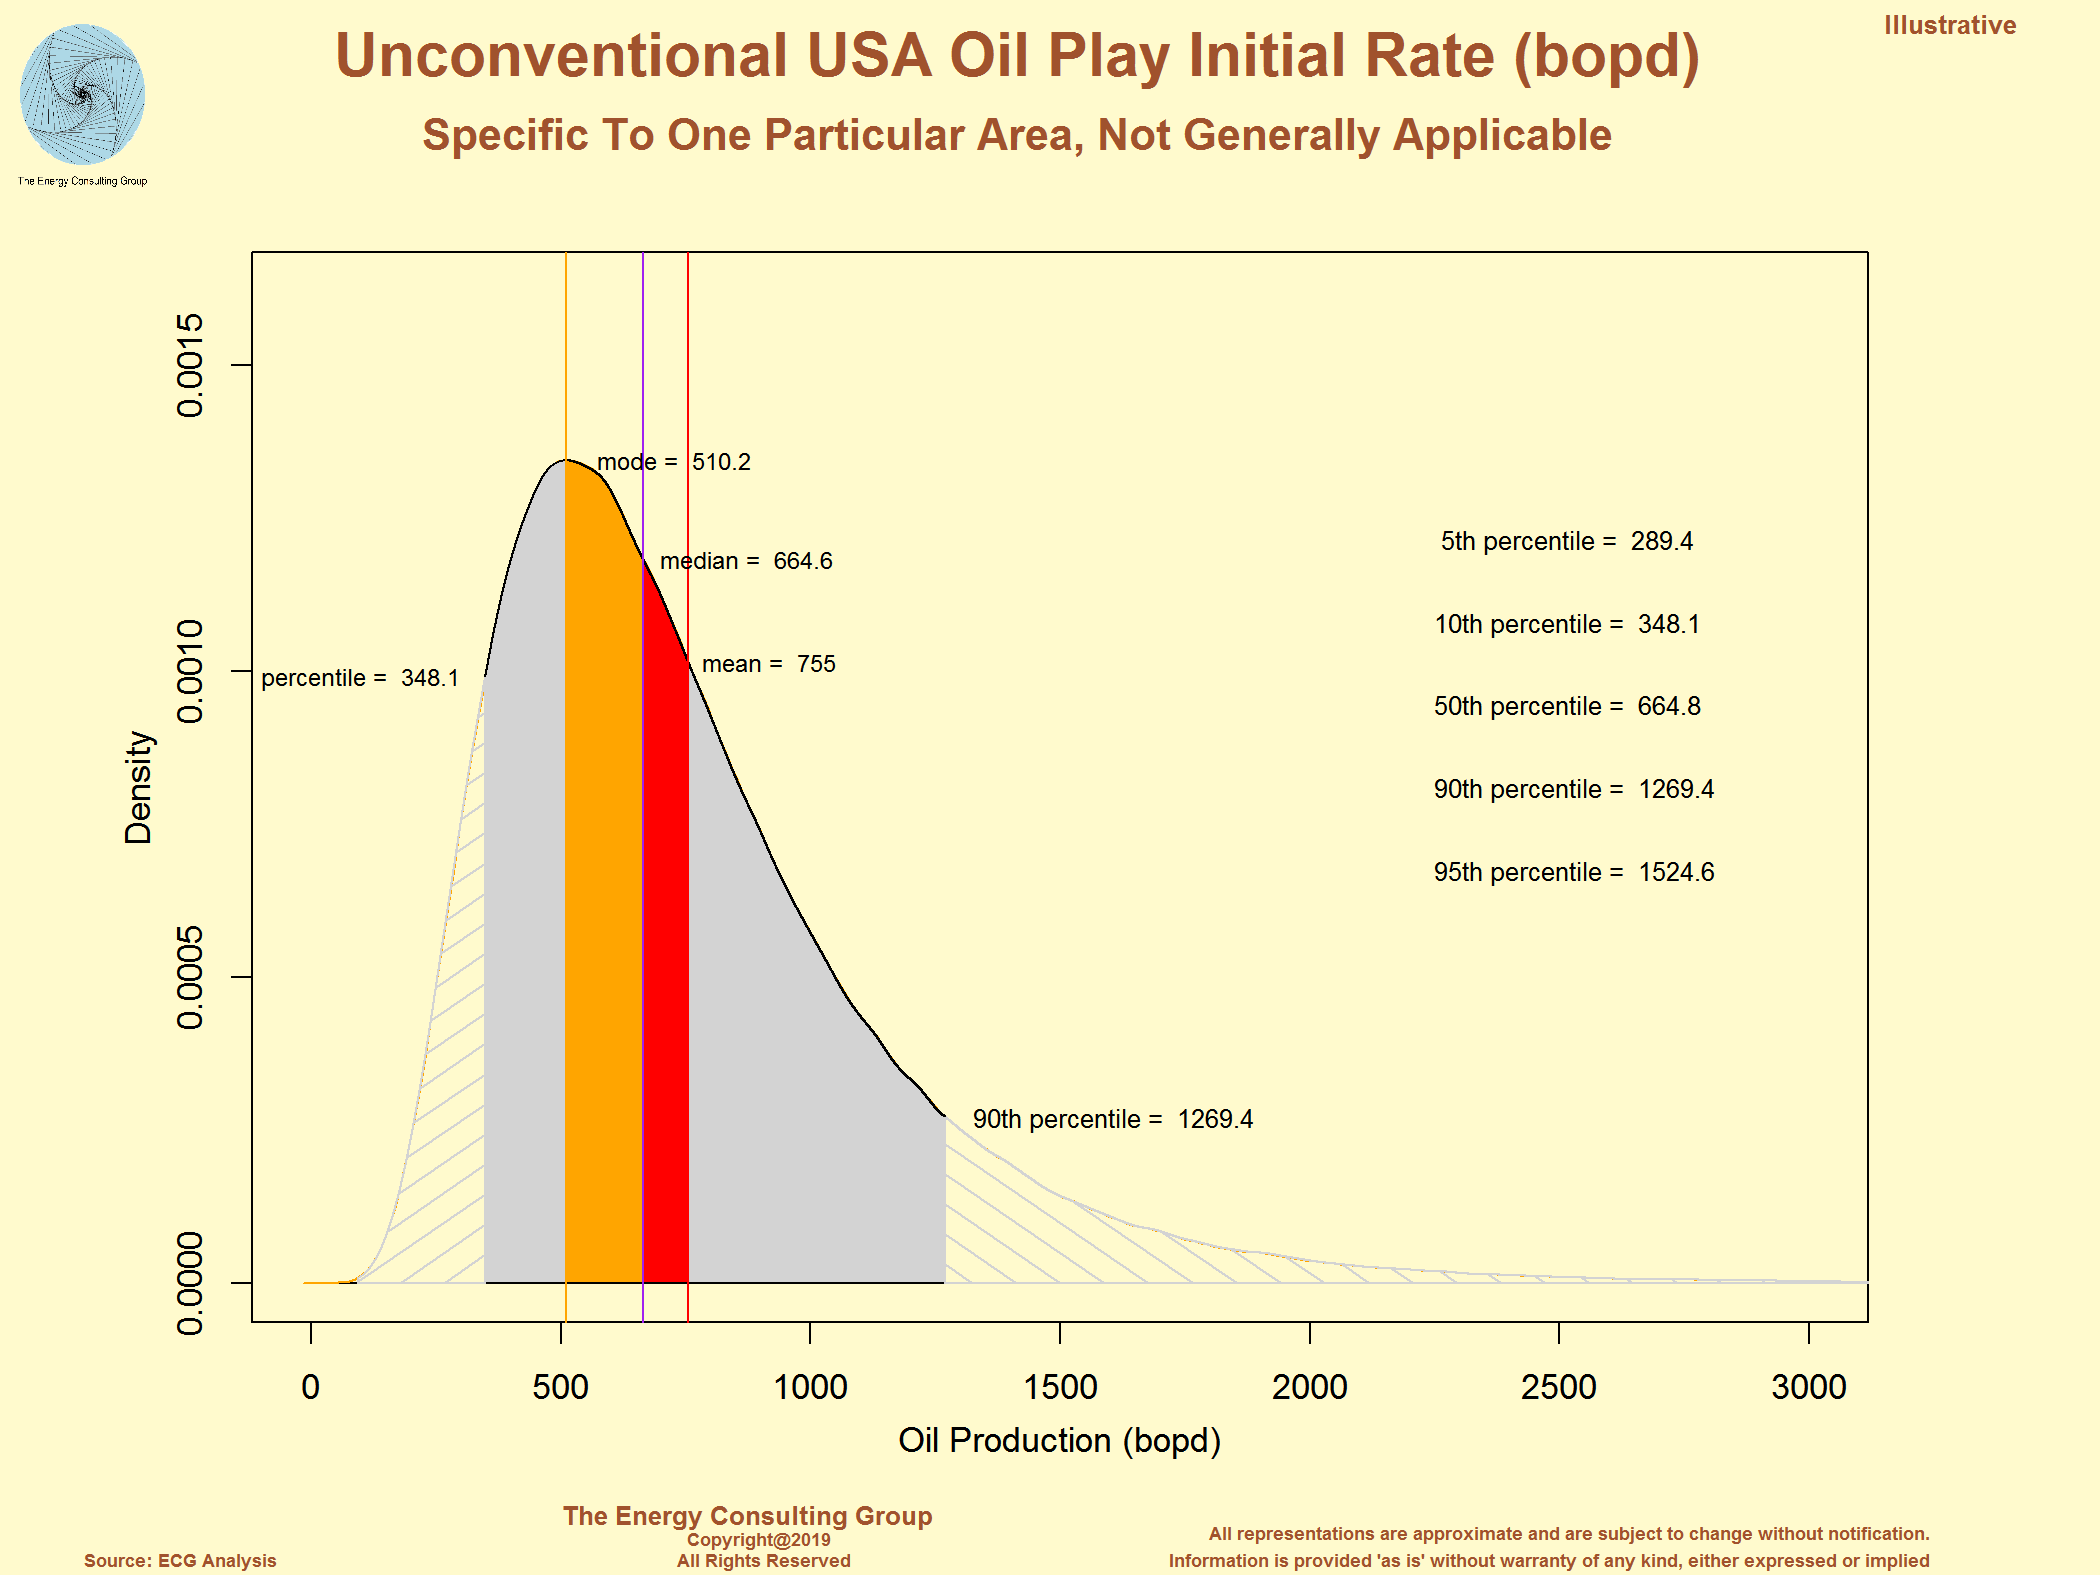 |
| R_Exhibit C Porcupine Chart for a Specific Unconventional Oil Area (not generally applicable) 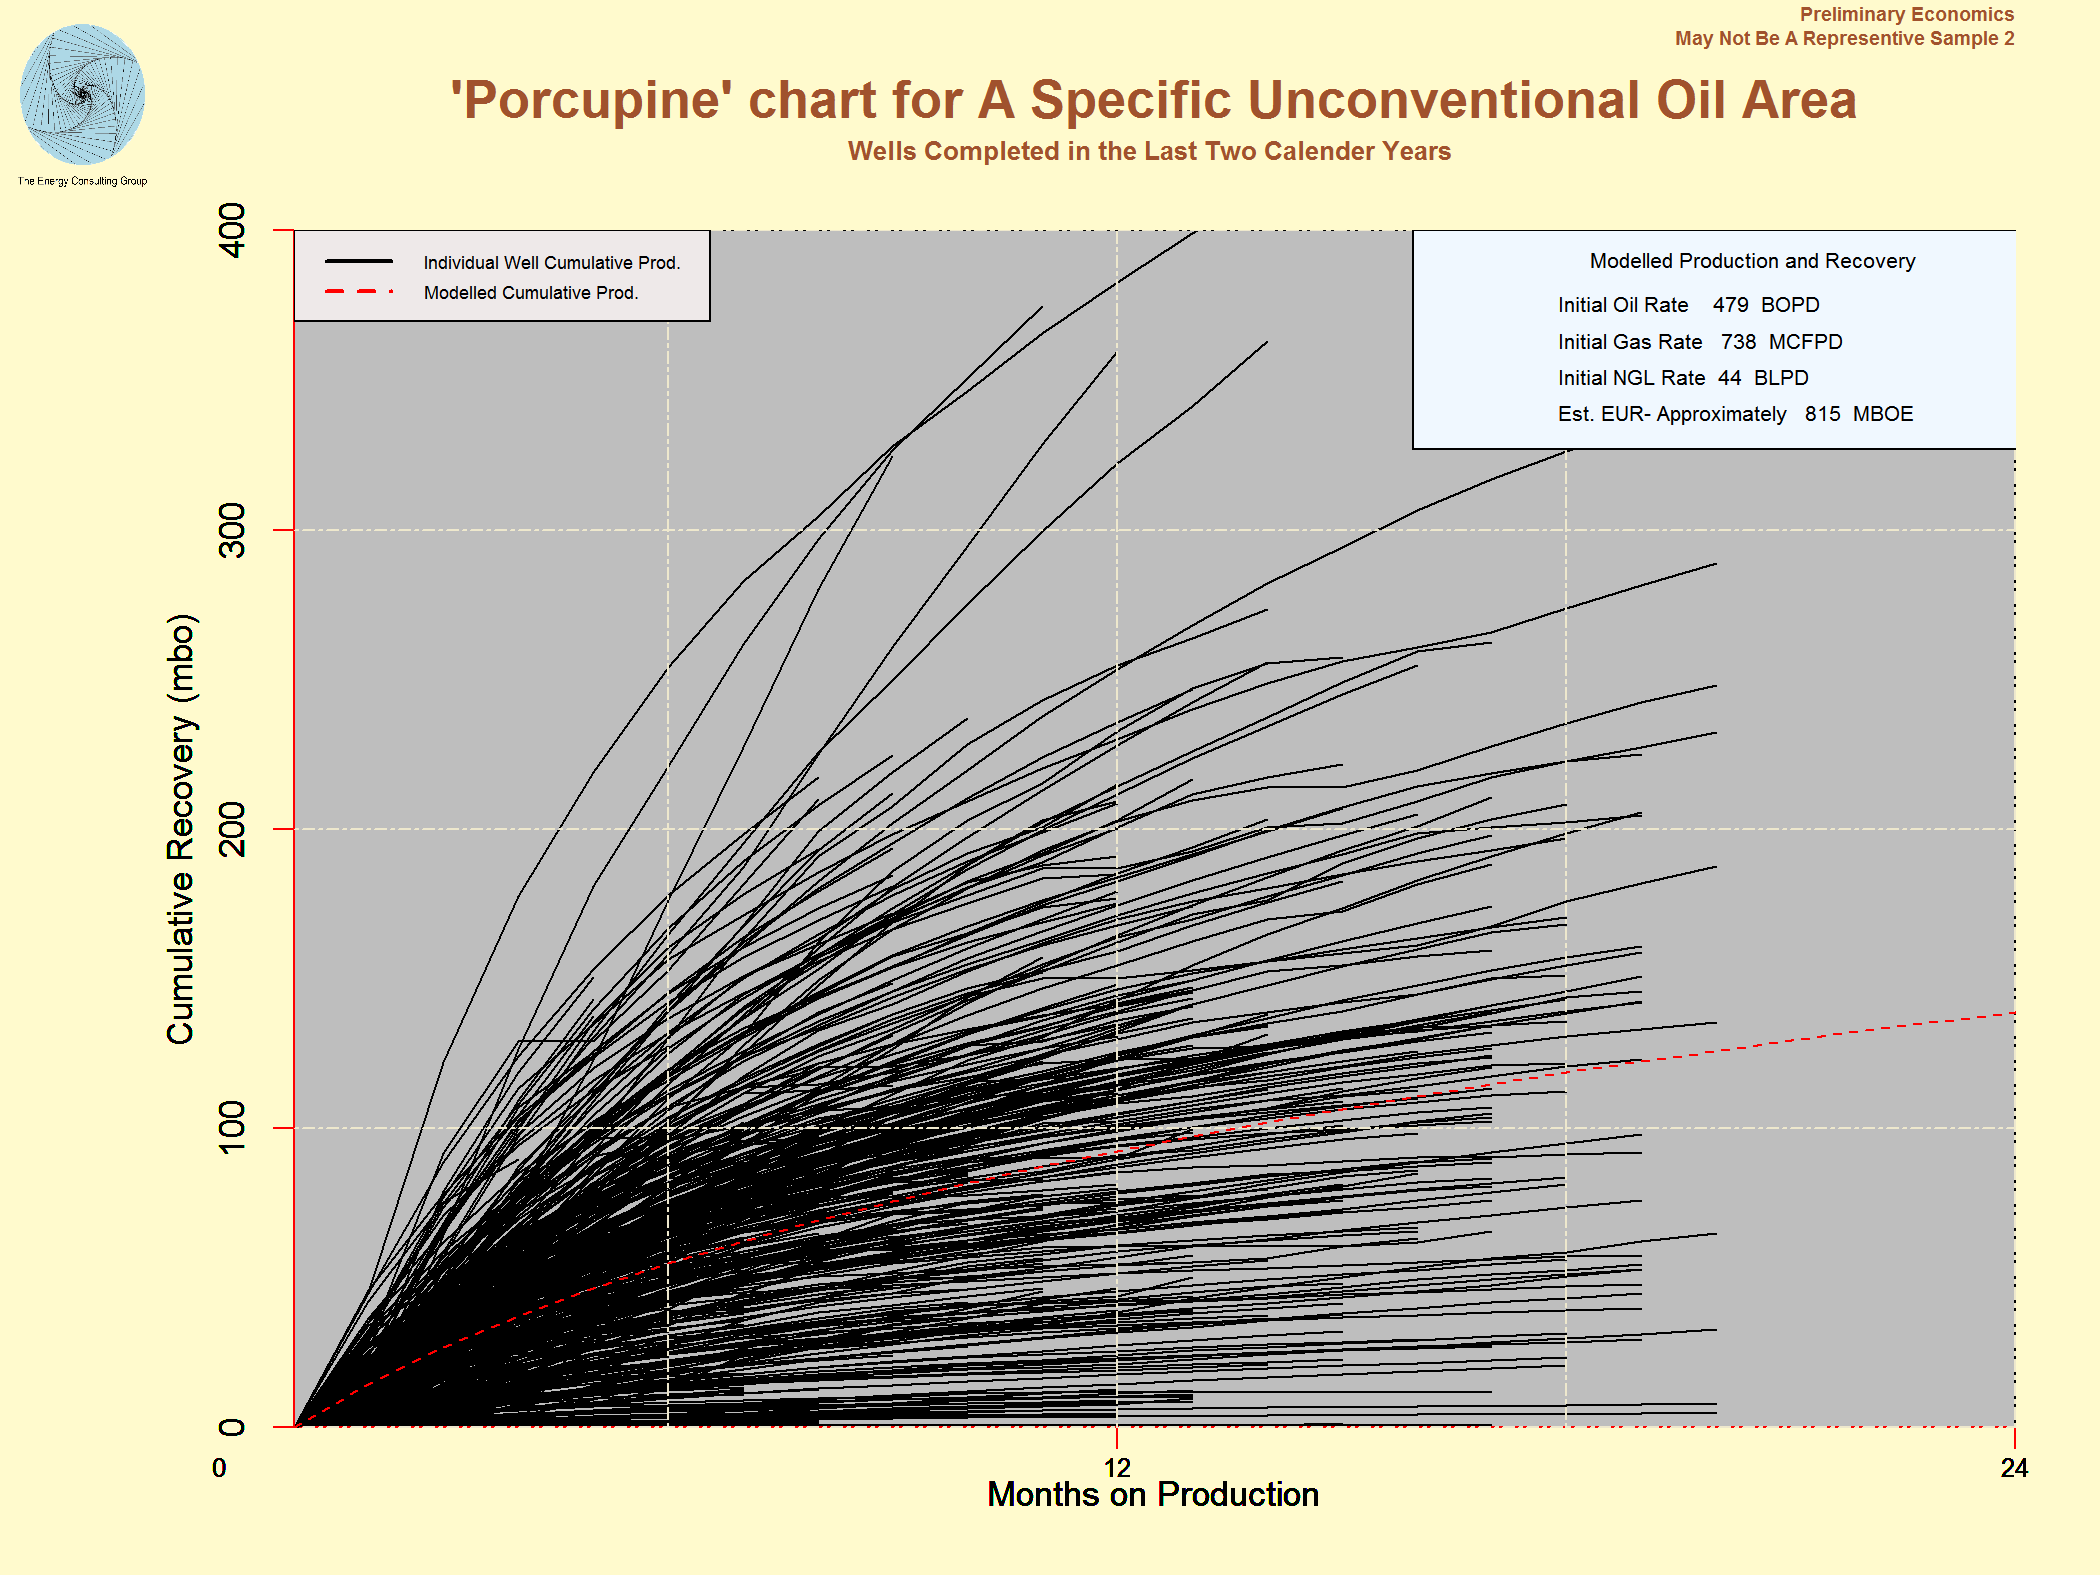 |
R_Exhibit D Distirbution Fit Peak IP30 (not generally applicable) 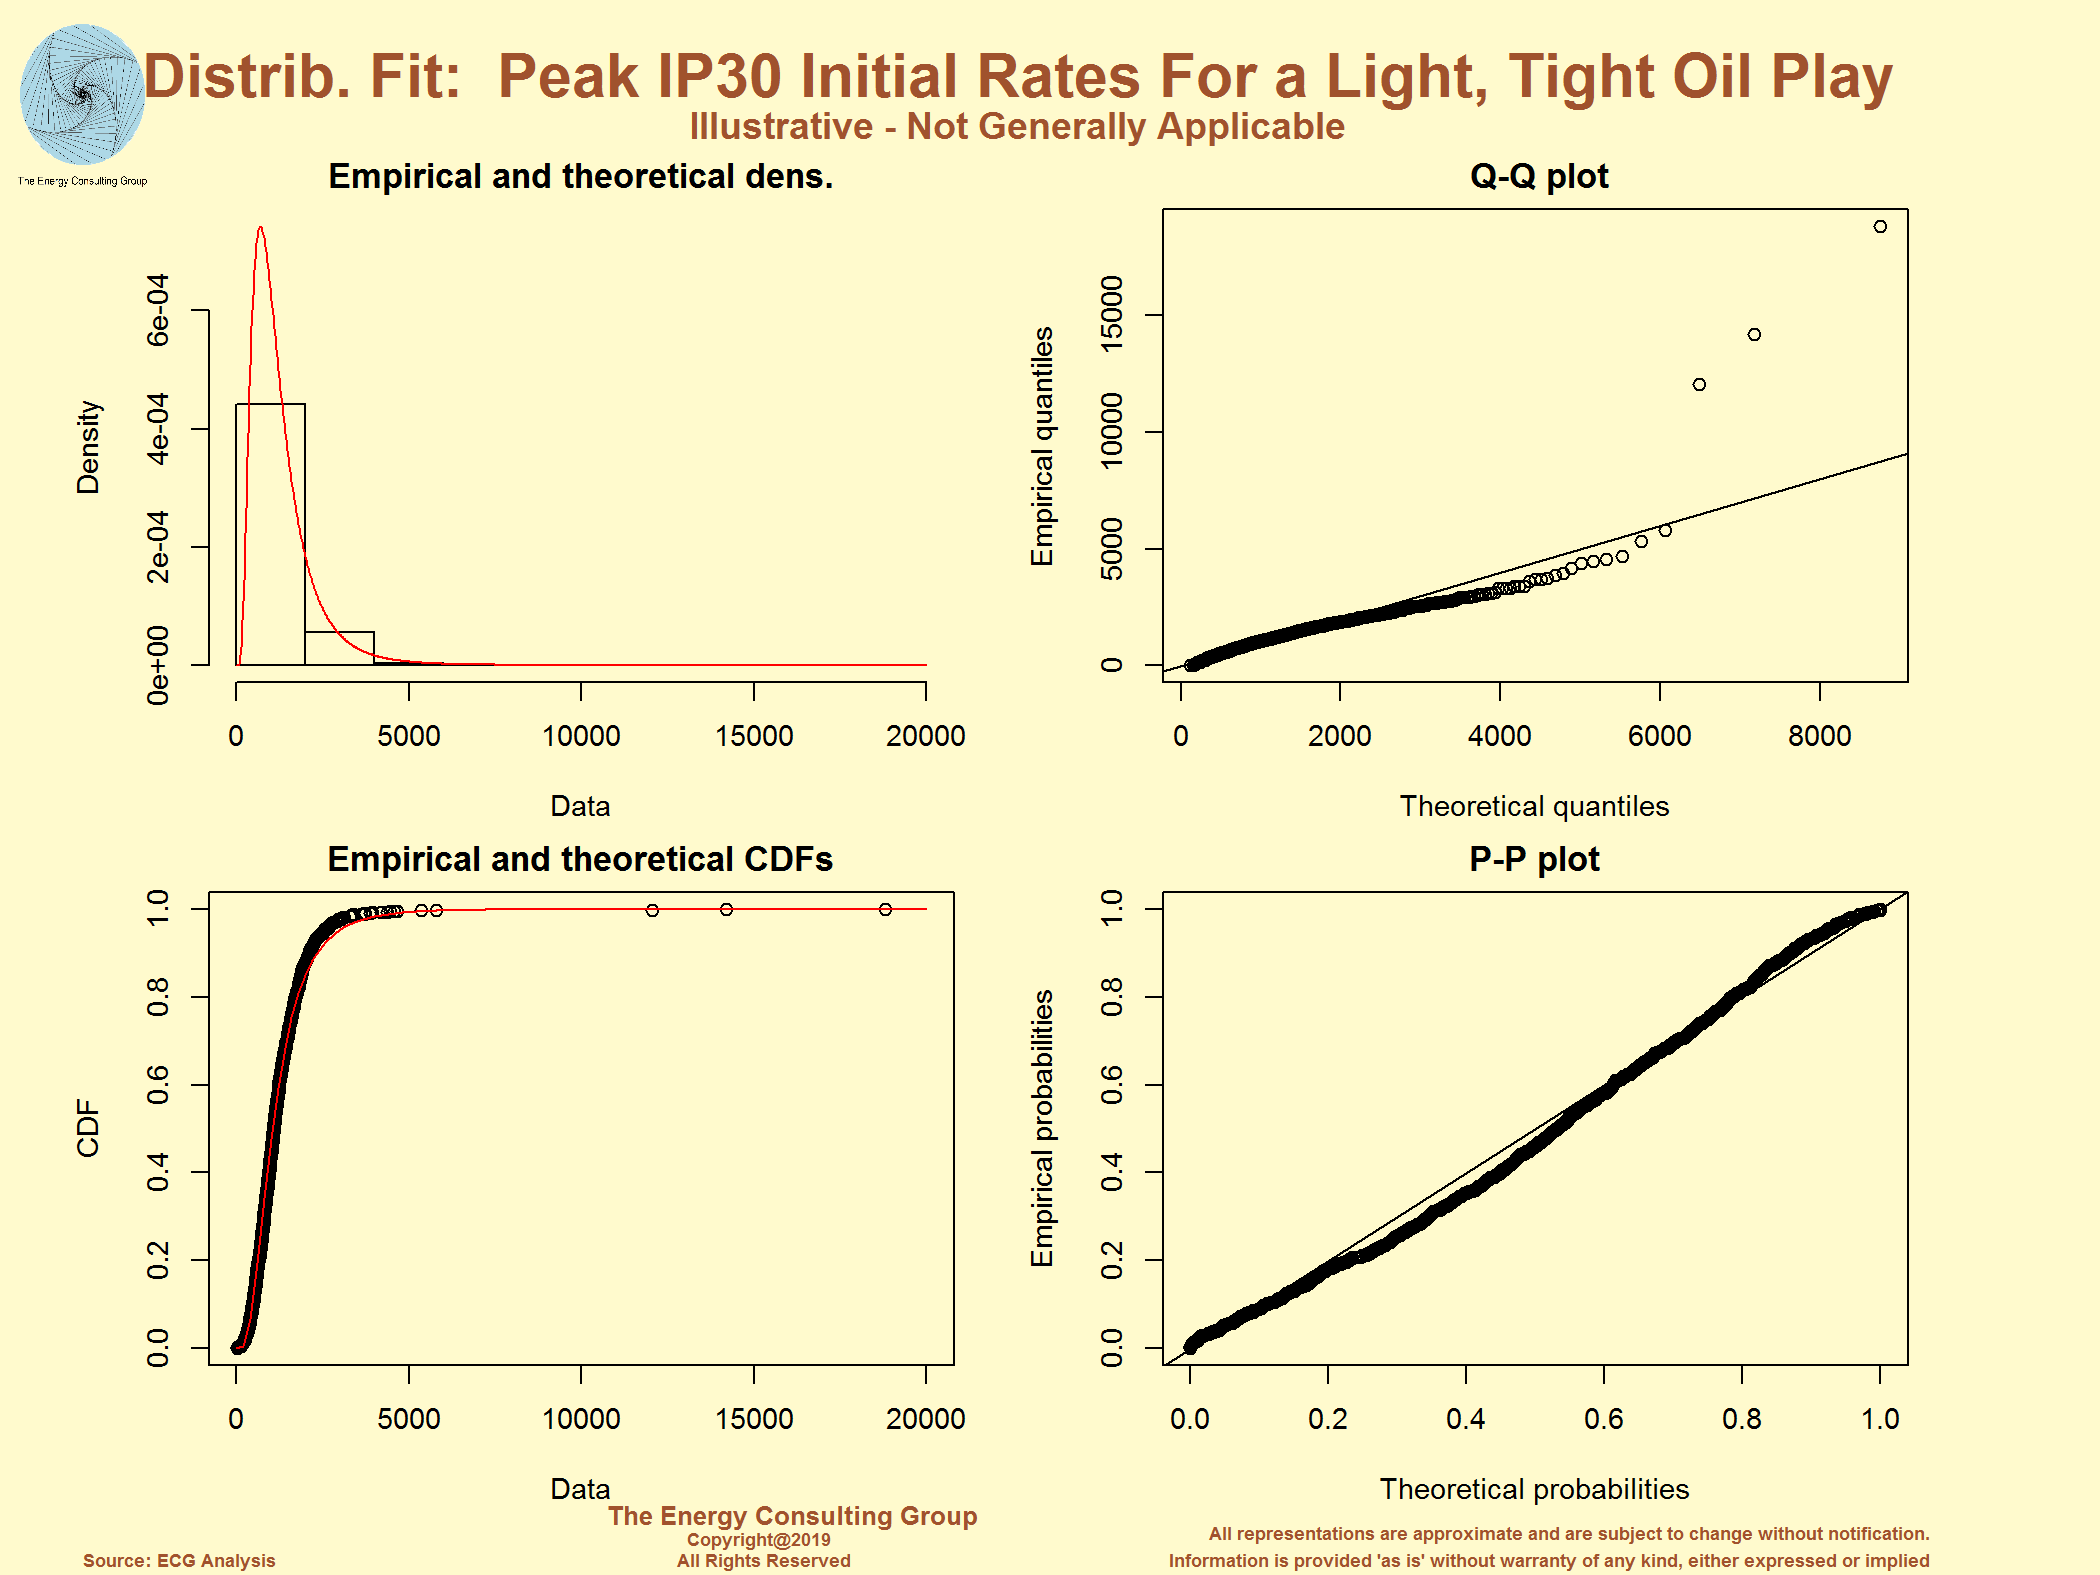 |
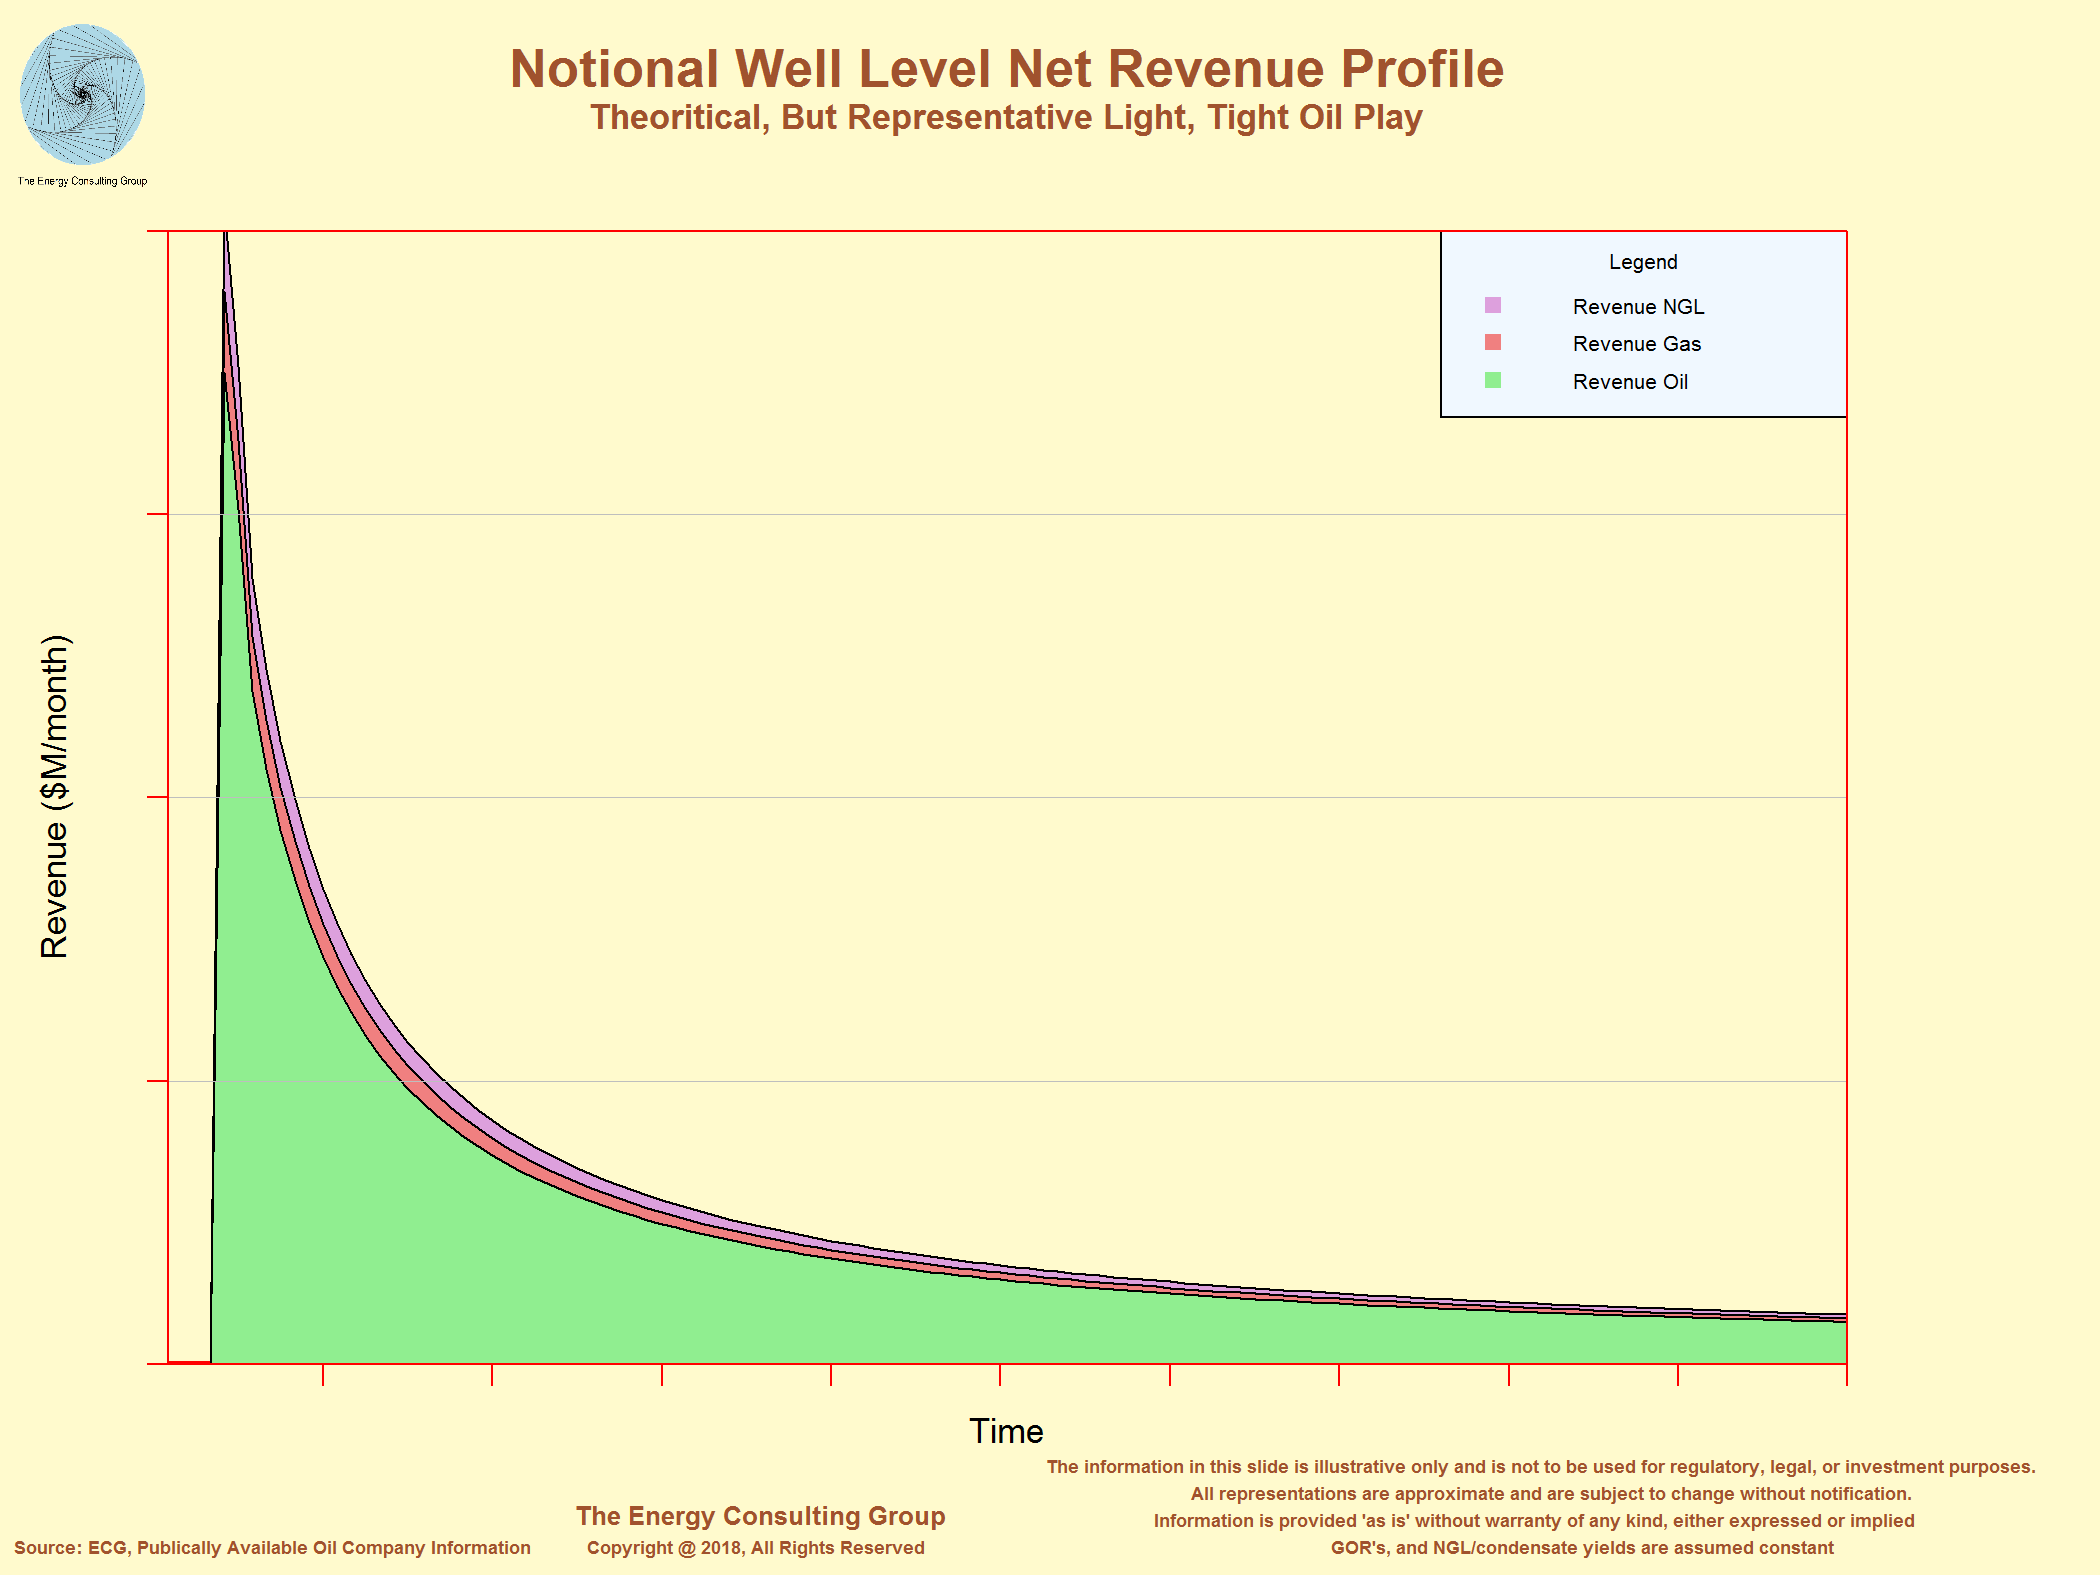
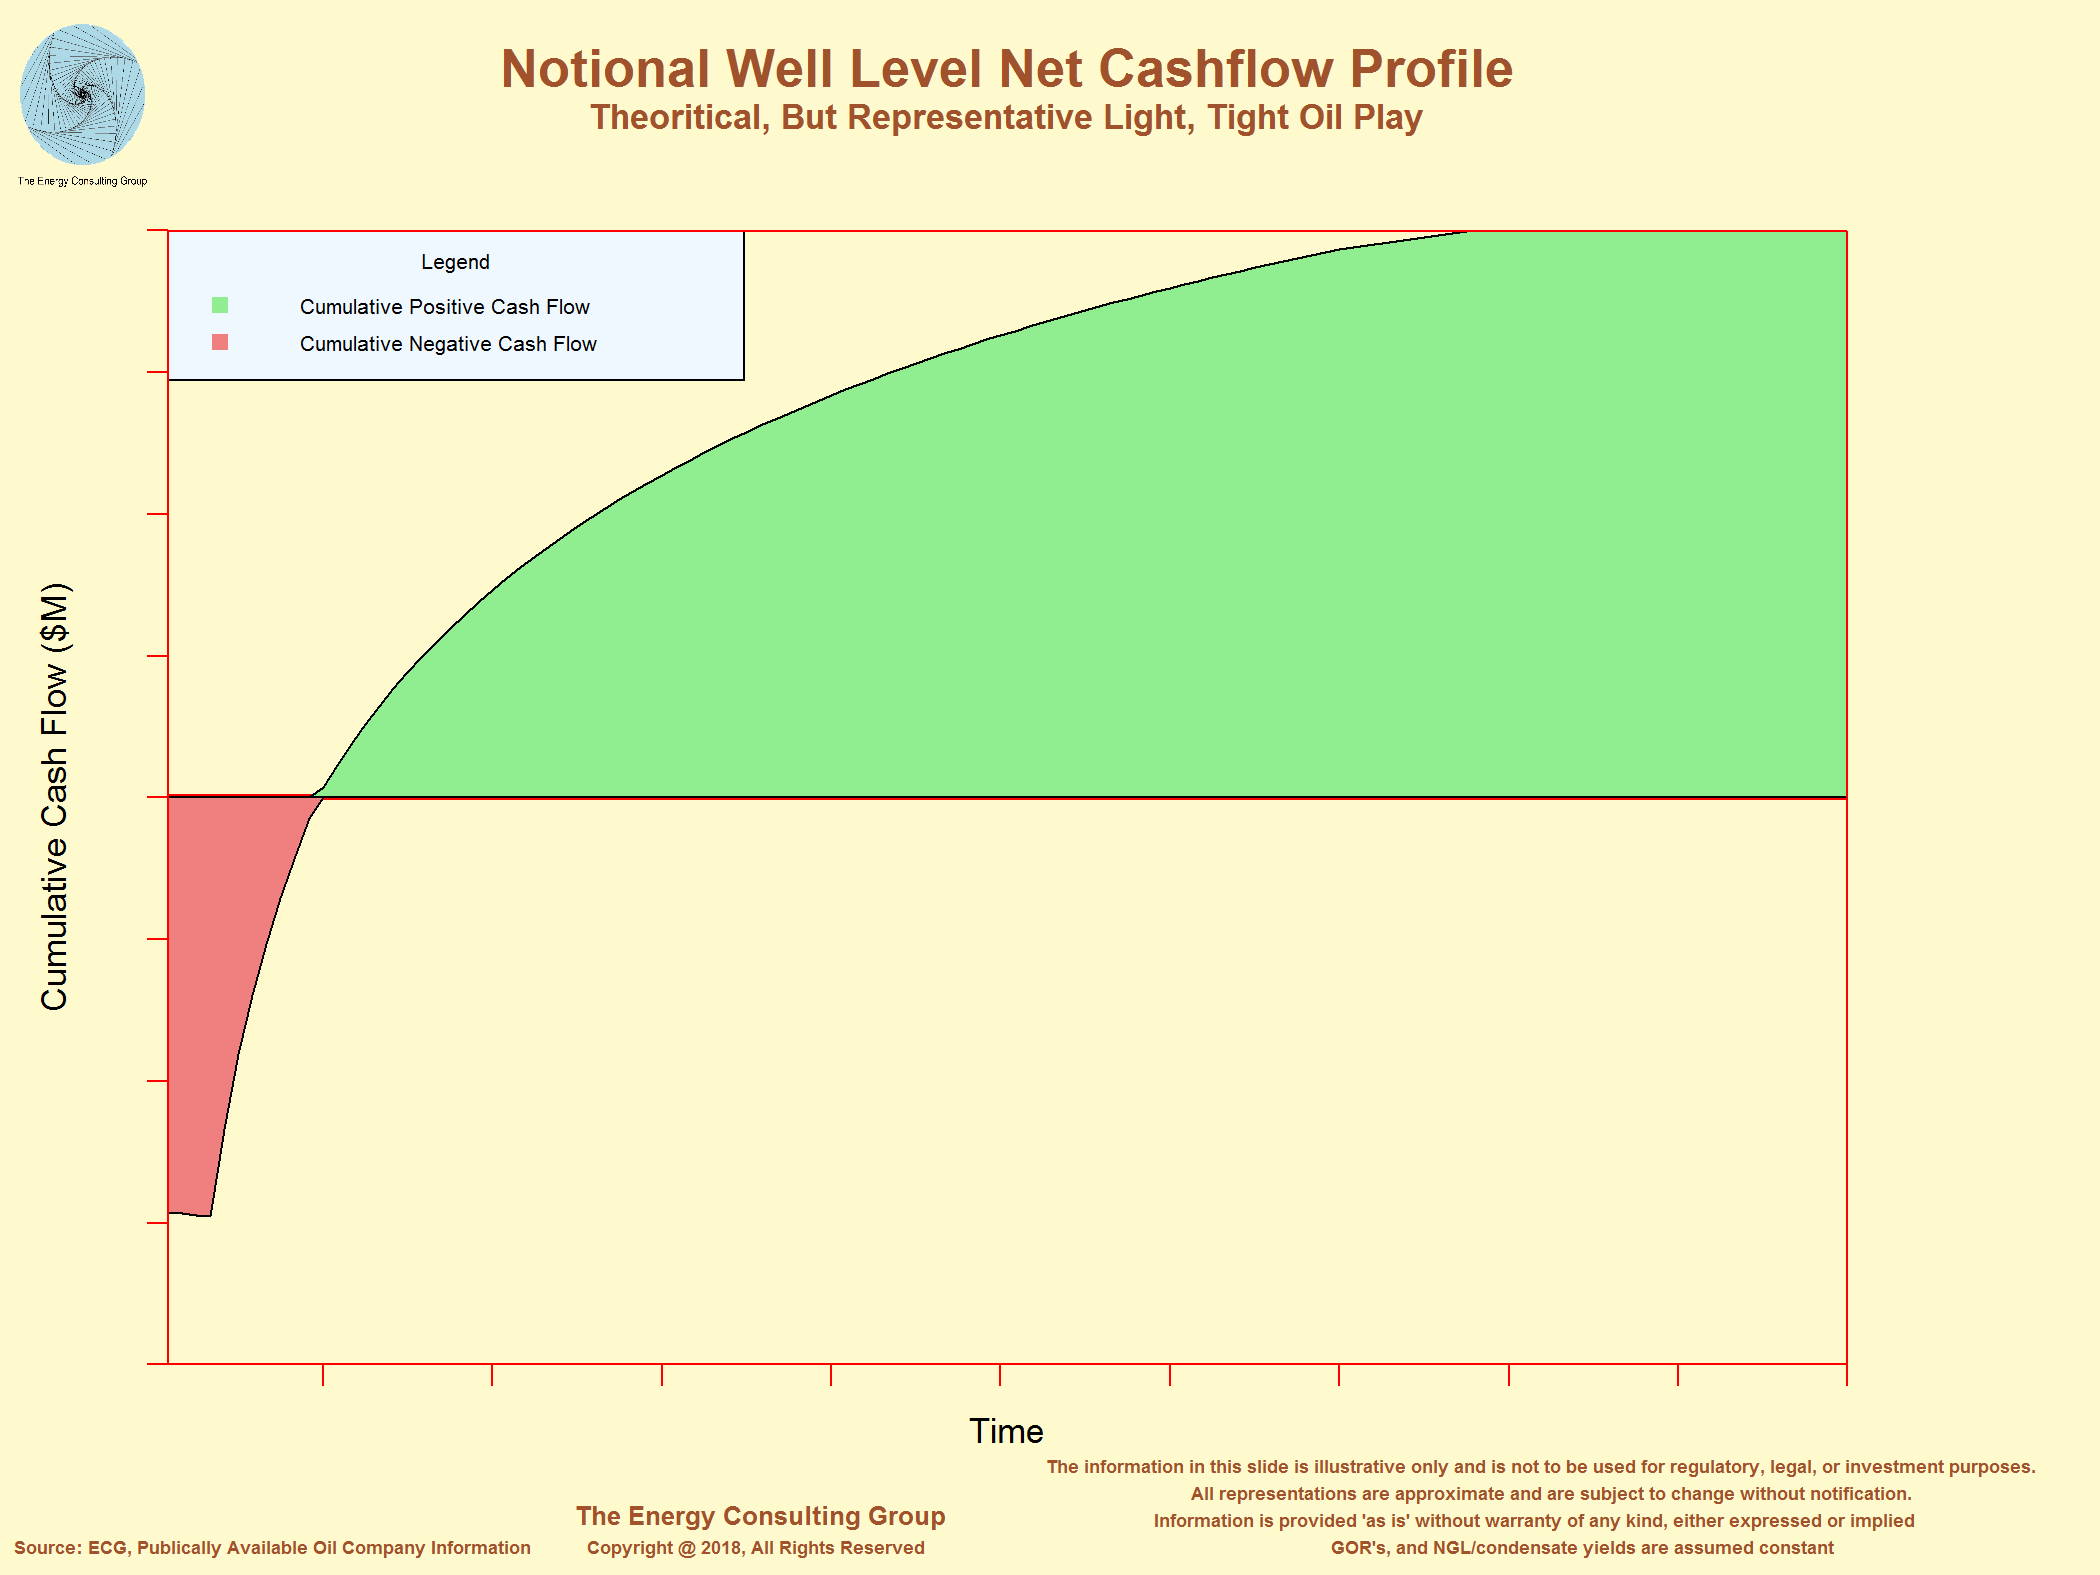
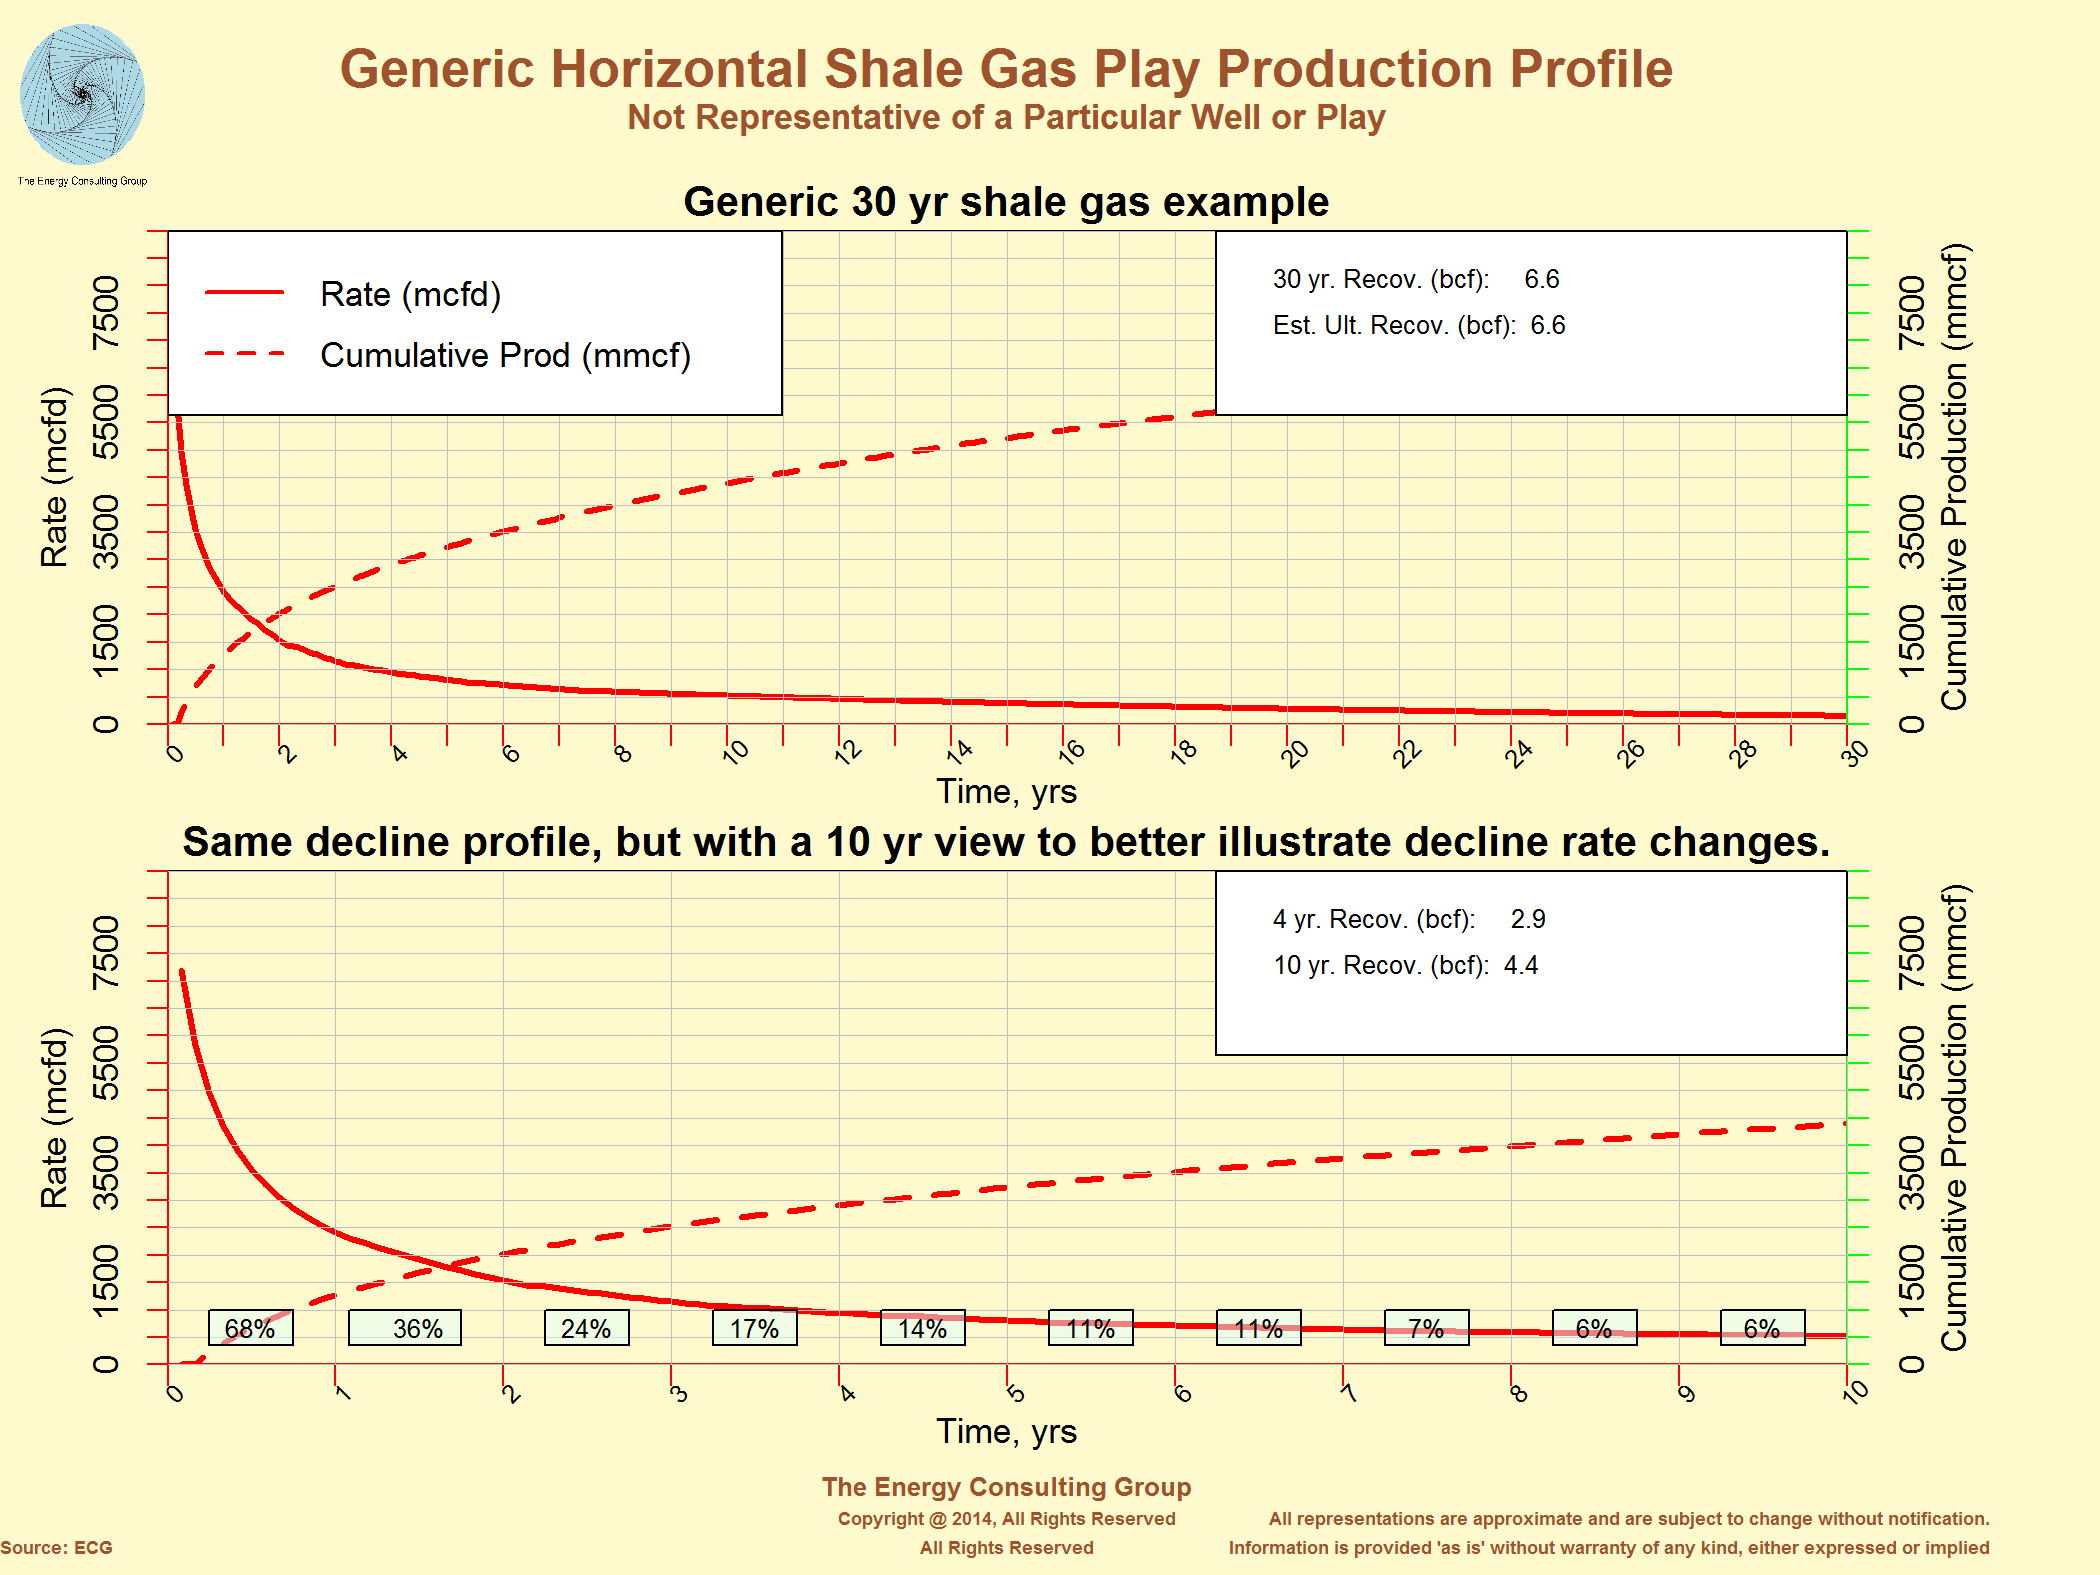
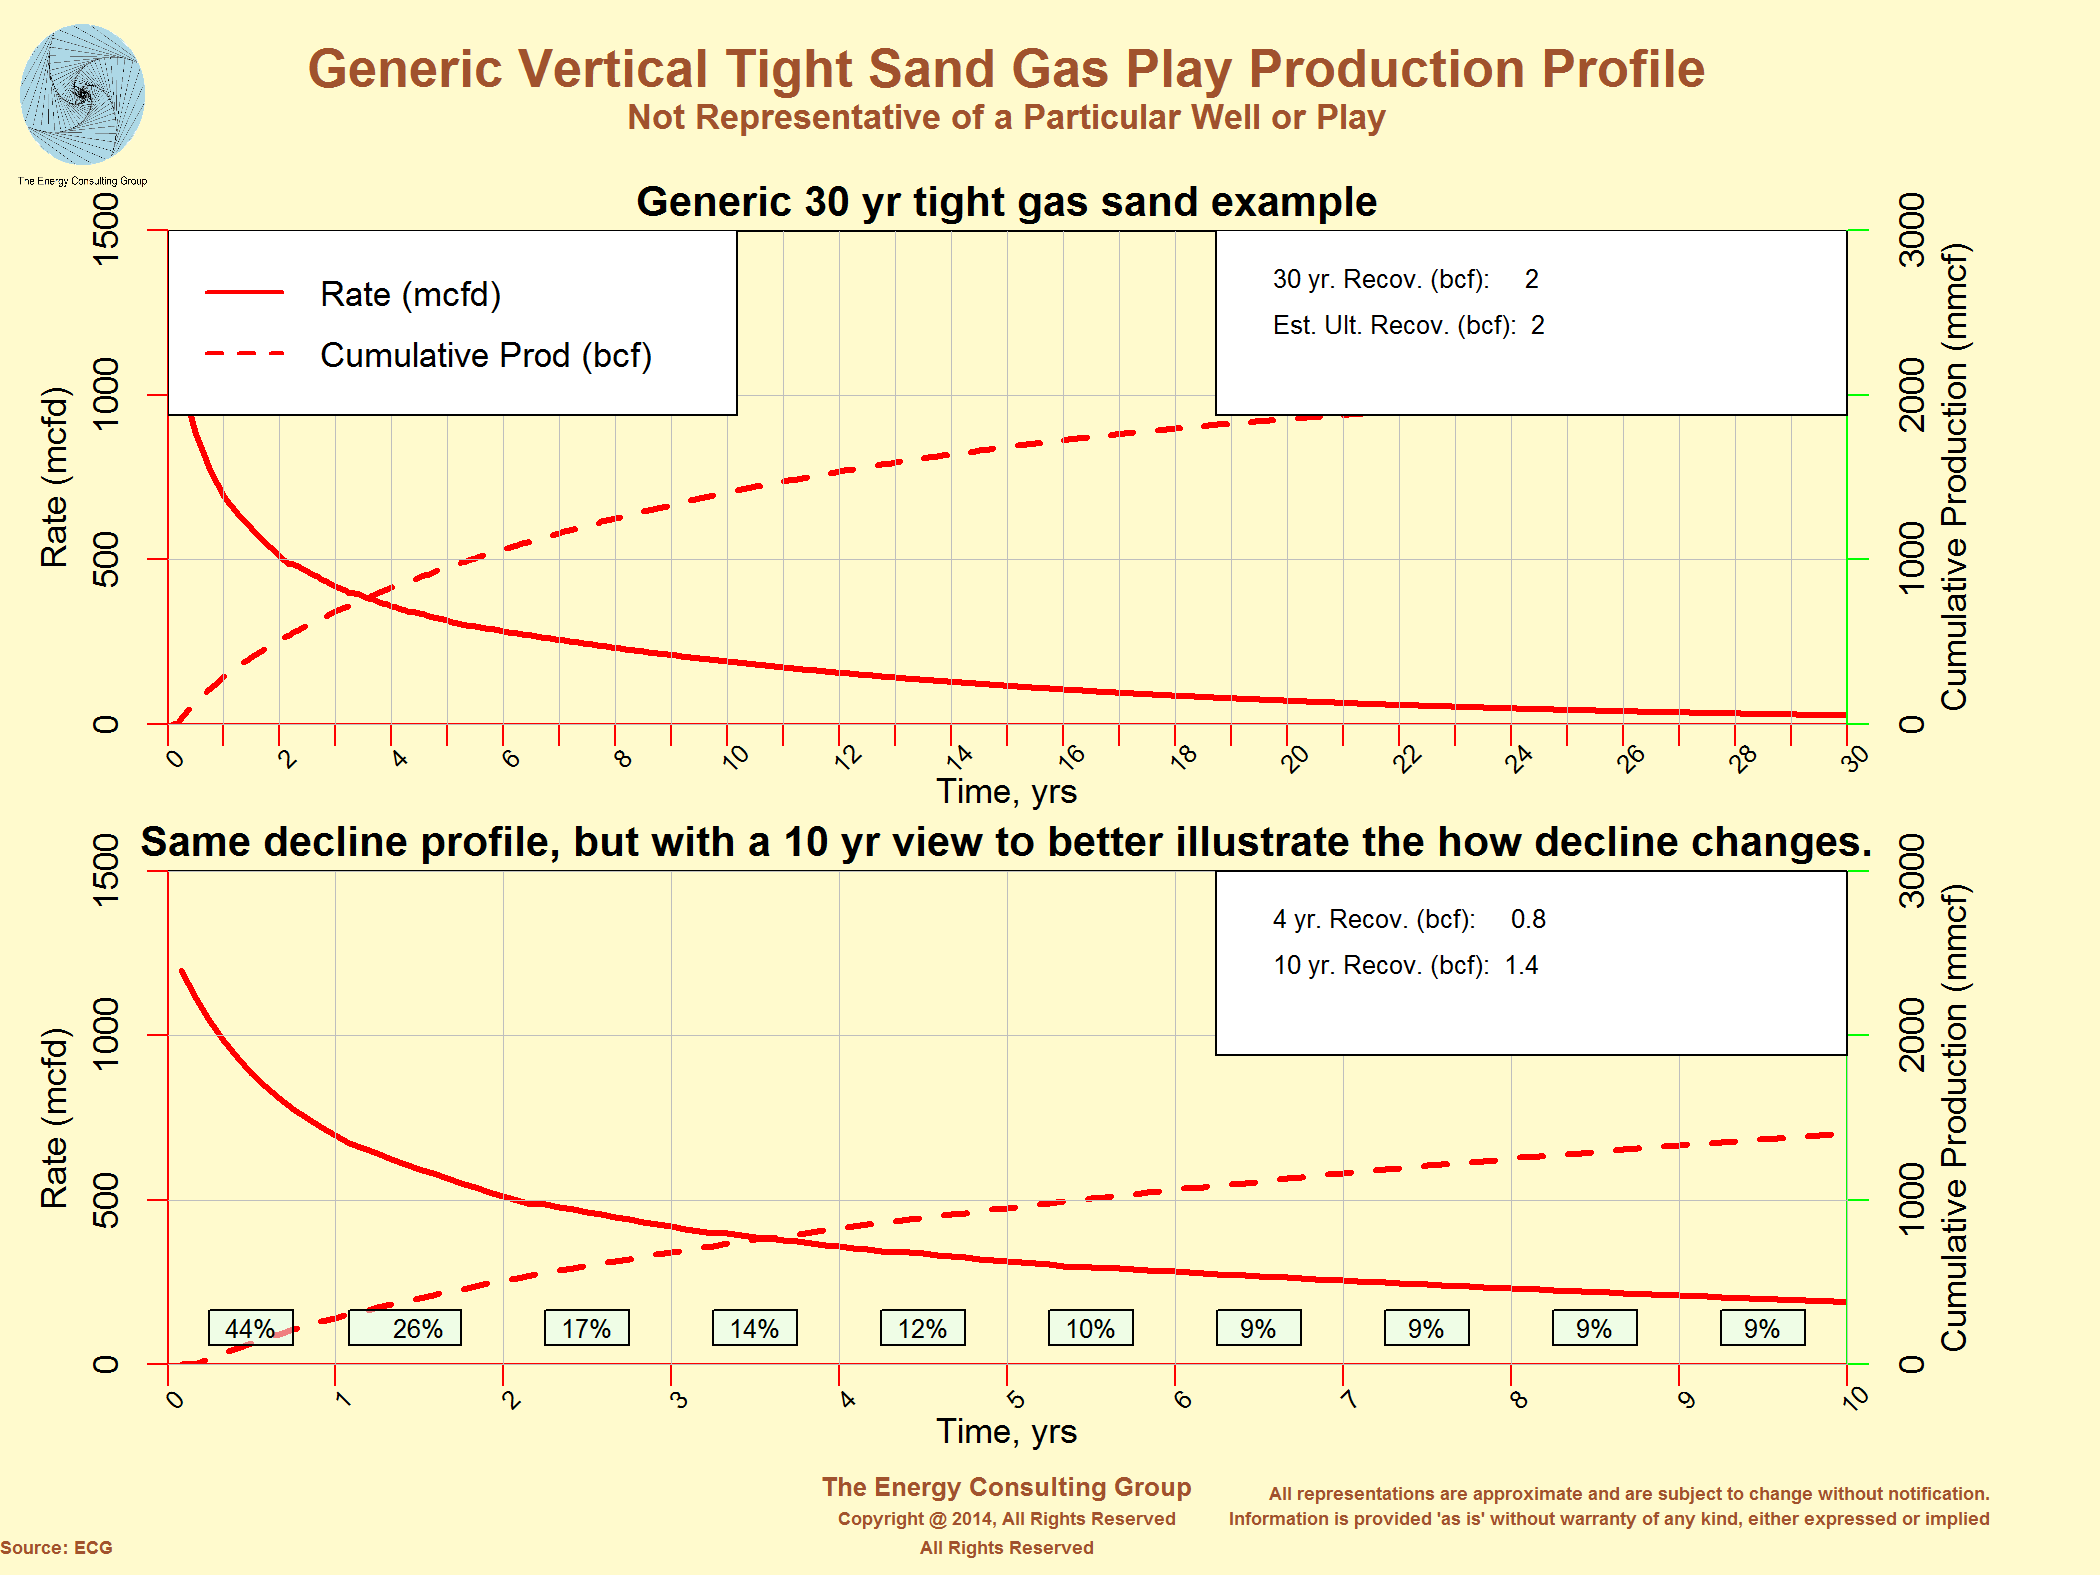
Decline profile: An obvious characteristic, and the one that receives considerable attention from non-industry observers, is the decline profile of a shale well (see Exhibit 2). The defining feature is the relatively high initial decline rate in comparison with "conventional" sandstone and carbonate plays (see Exhibit 3). However, a subtle transformation can take place as a well ages. The high initial decline can transition into lower decline rates over the longer term. These lower, longer term declines mean that after a handful of years, many shale wells can transition into long lived, low cost cash cows.
Exhibit 2: Horizontal Oil Play: Potential New Well Production Profile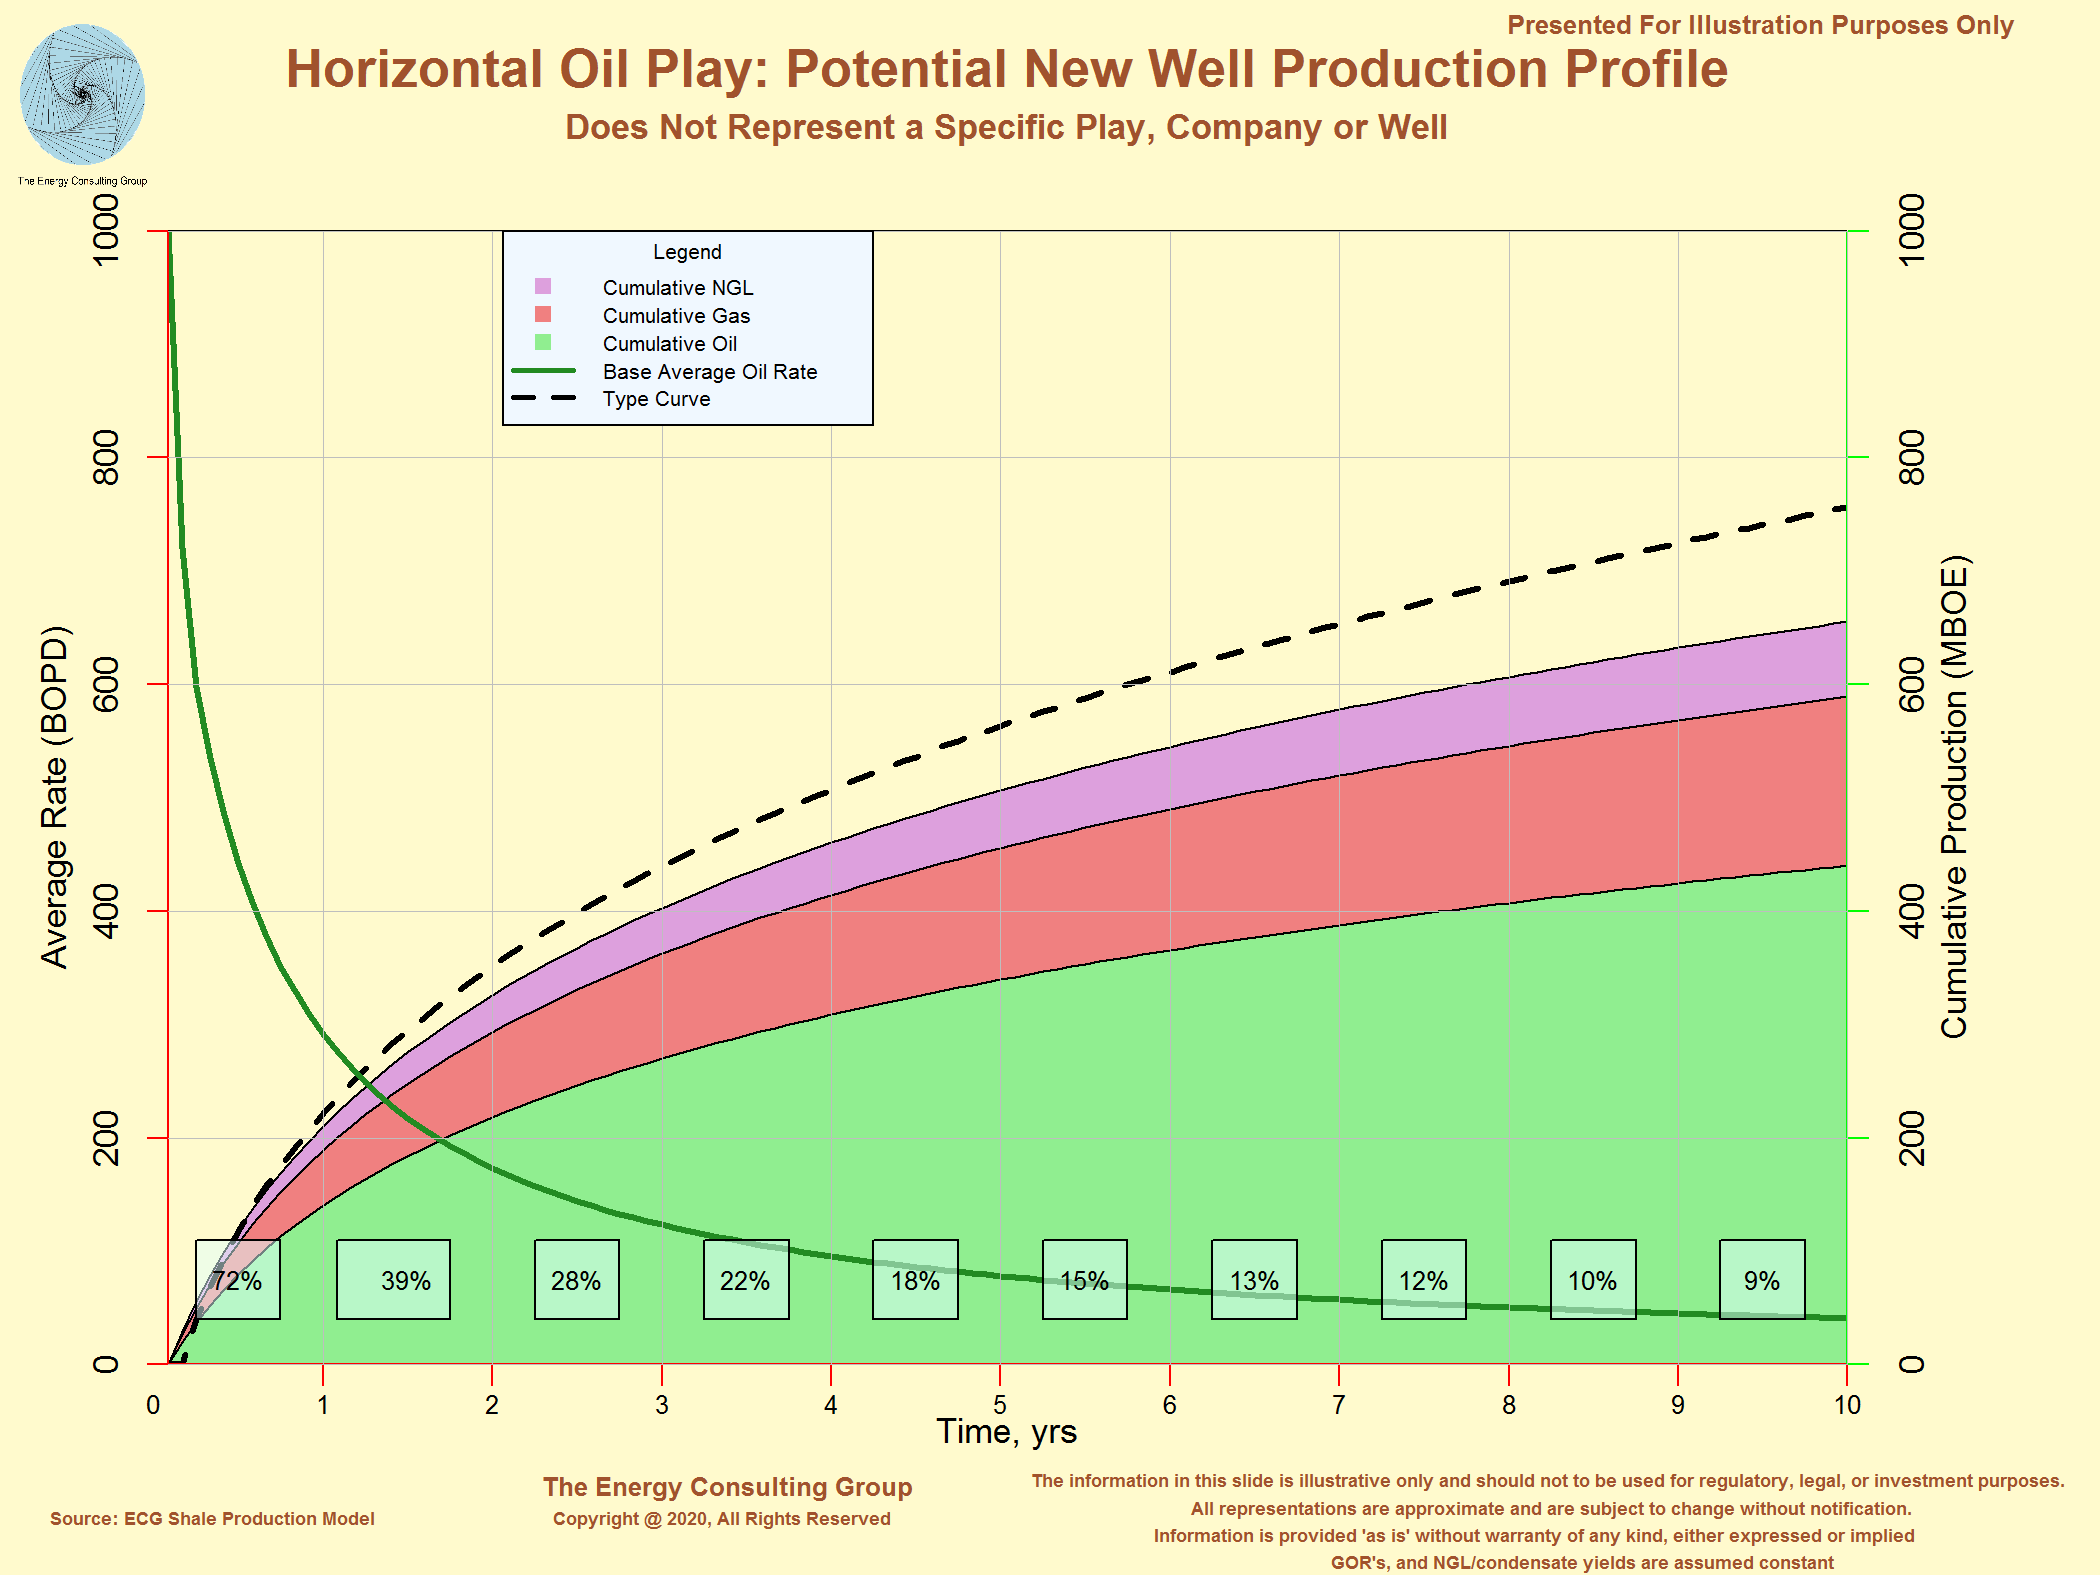 Click Image for Full Size |
Exhibit 3:
Conventional Oil Play: Potential New Well Production Profile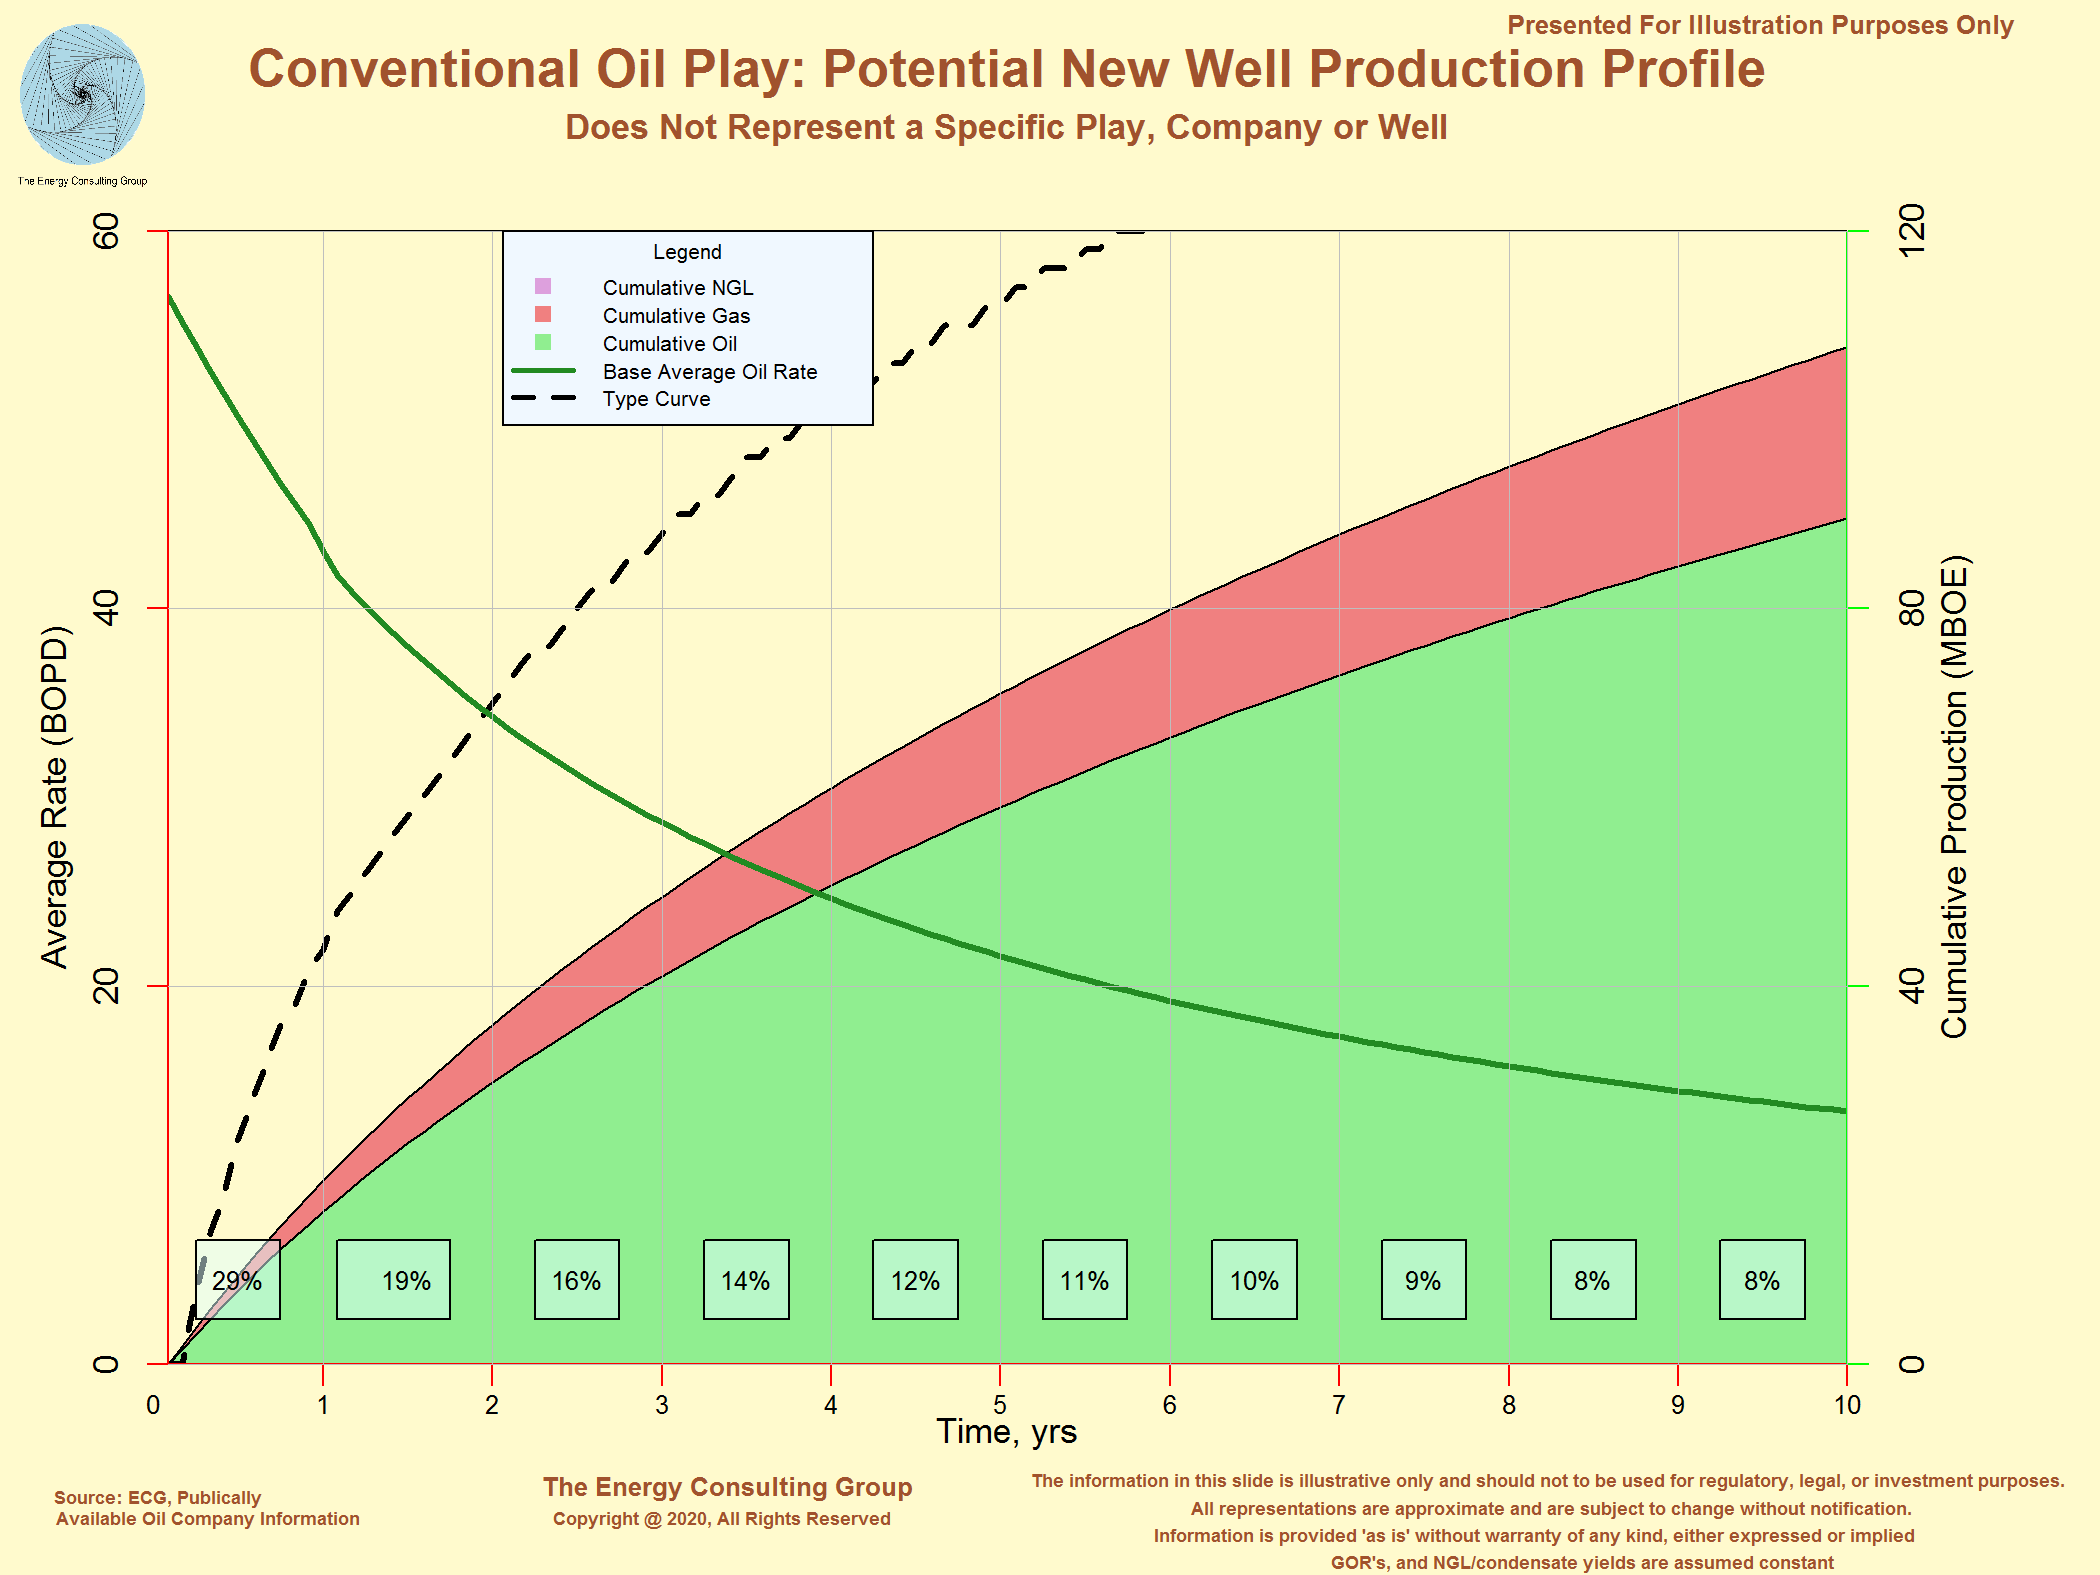 Click Image for Full Size |
High Well Costs: The two primary technologies behind the shale revolution are horizontal drilling and large scale, multi-stage fracking. This page is not the place to discuss each of these in detail except to note that they can add considerable costs to a well, resulting in well costs that are much greater than when drilling a vertical well and using "conventional" completions. In short, successfully applying these technologies costs about 3-5 times as much as a conventional well of similar TVD in the same area. To illustrate this point, please look to the exhibit titled, "Drilling Cost Segmentation", which is a breakdown of cost categories for drilling and completing an average well in one of the major shale plays. What is notable is the dominace of the fracing (pressure pumping) costs.
Illustrative Drilling Cost Segmentation
for a Shale Well in One Particular Play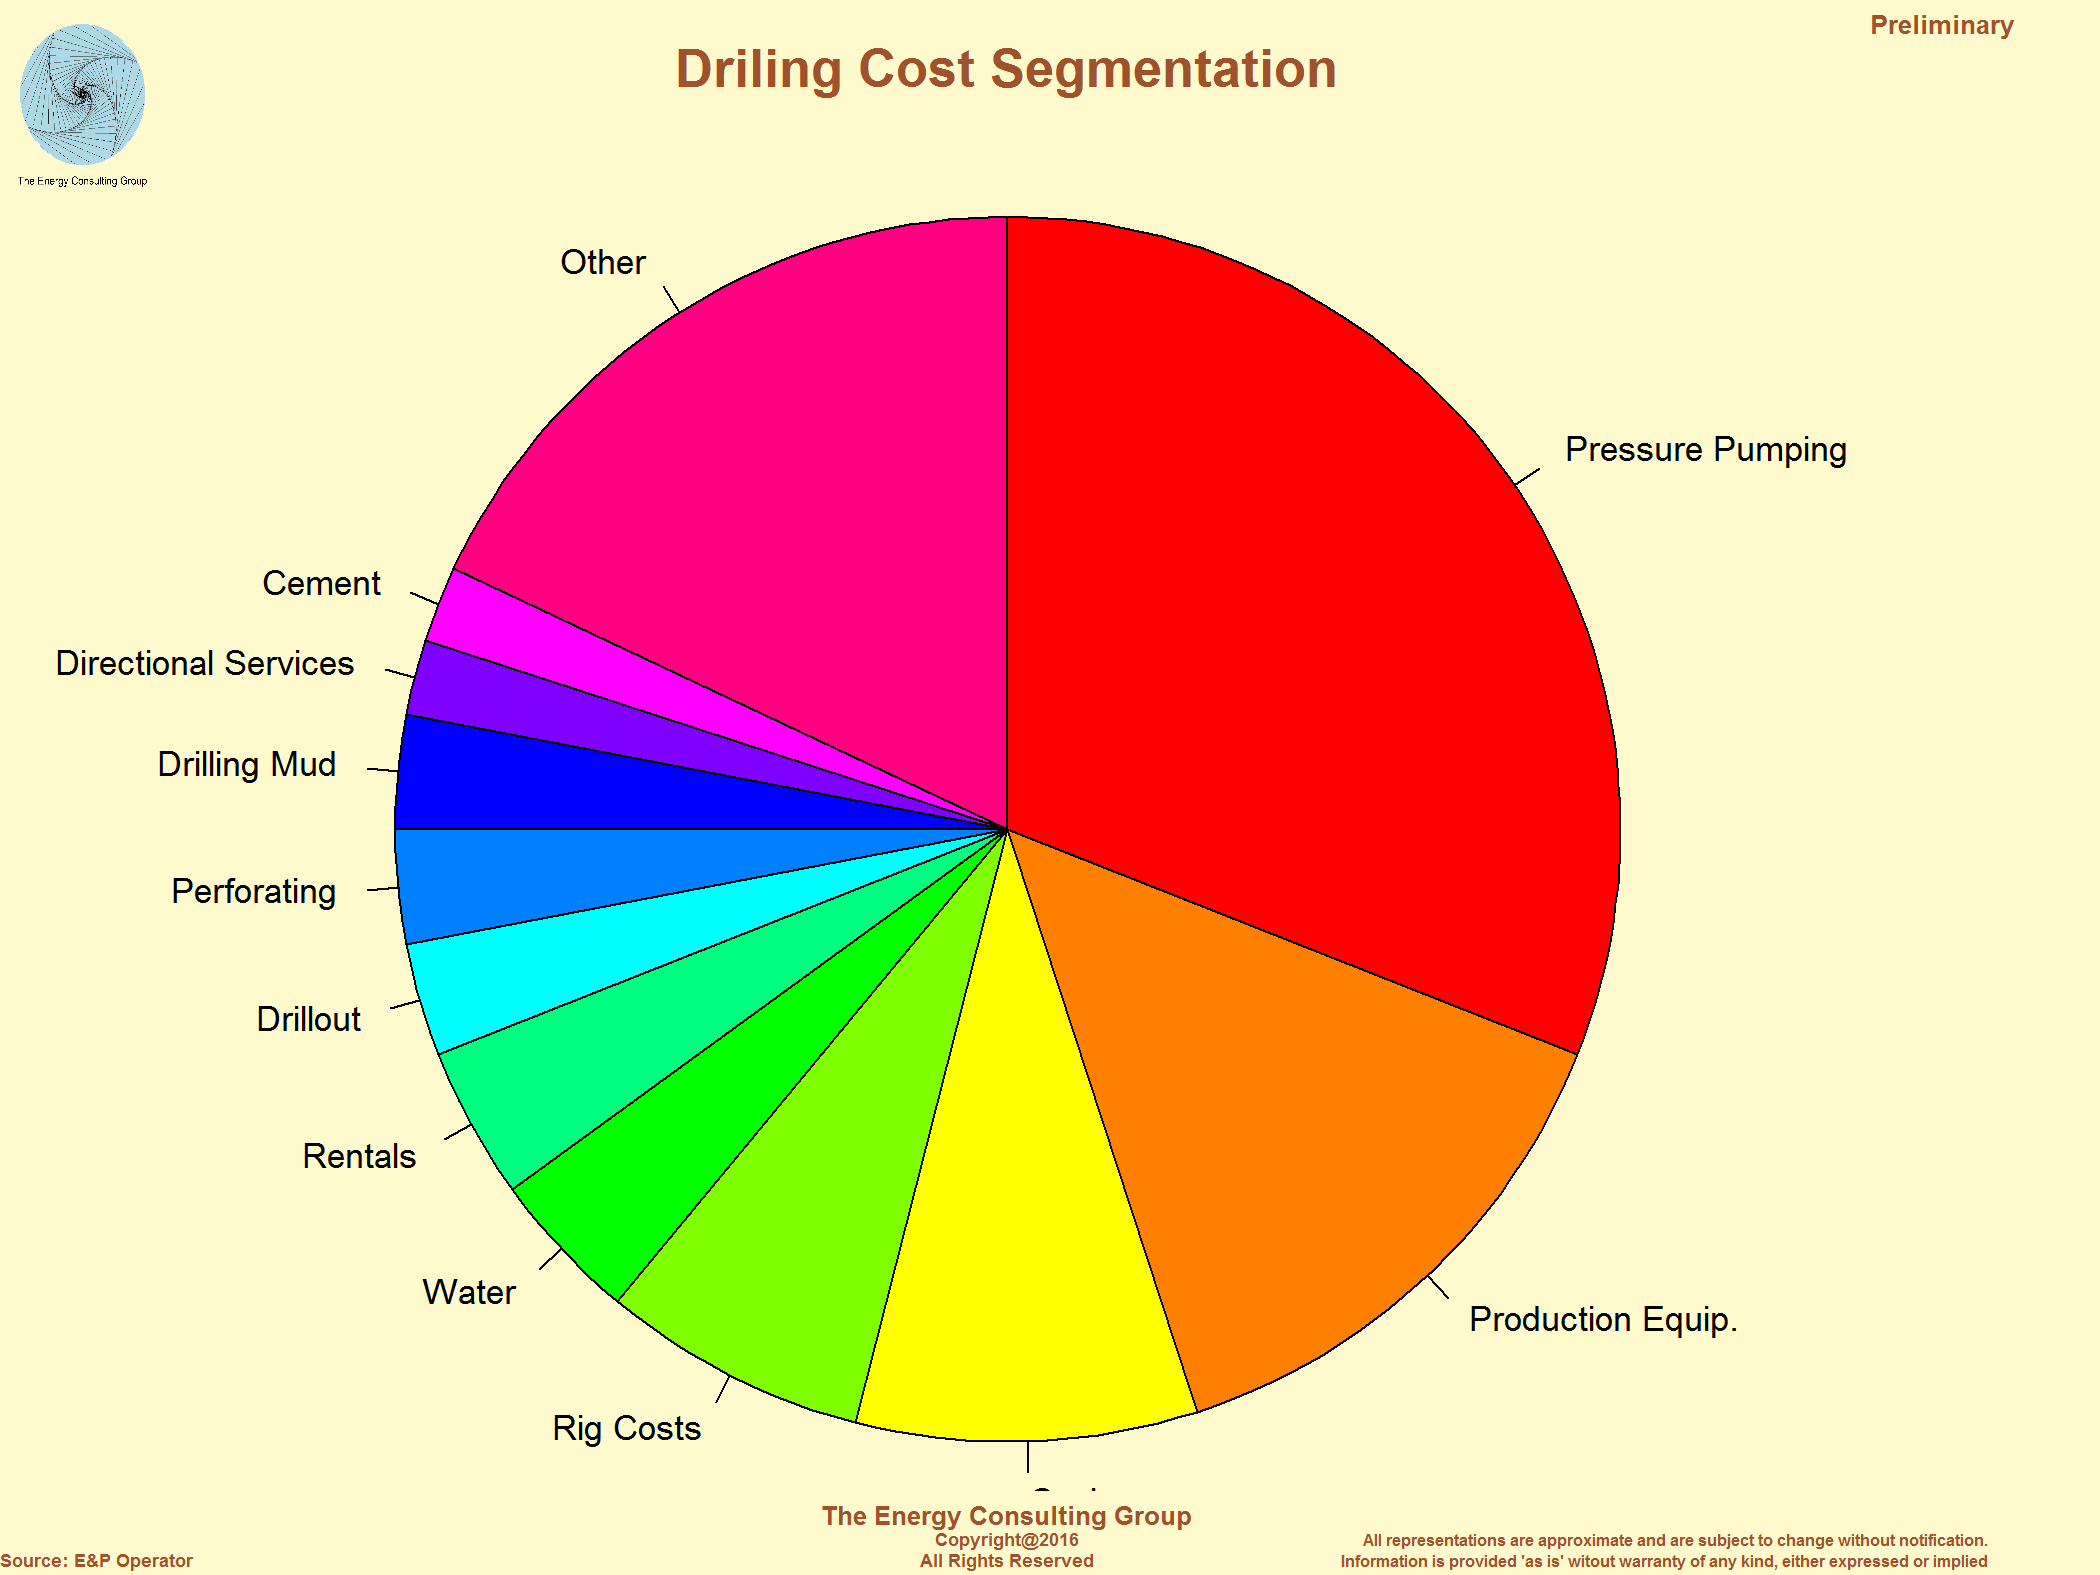 Click Image for Larger Version |
These three features (high rates, high declines and high costs) are the key defining factors when considering well level economics in shale plays. Please note, however, these are not all inclusive. This discussion is intentionally leaving out references to leasing costs, operating/gathering/processing/transportation costs, overhead, facility costs, etc. We do this not because these costs are not important, but because they are typically not as central to defining rates of return and net present values. That said, there are exceptions, especially fees related to gathering/processing/transporting the produced oil and gas.
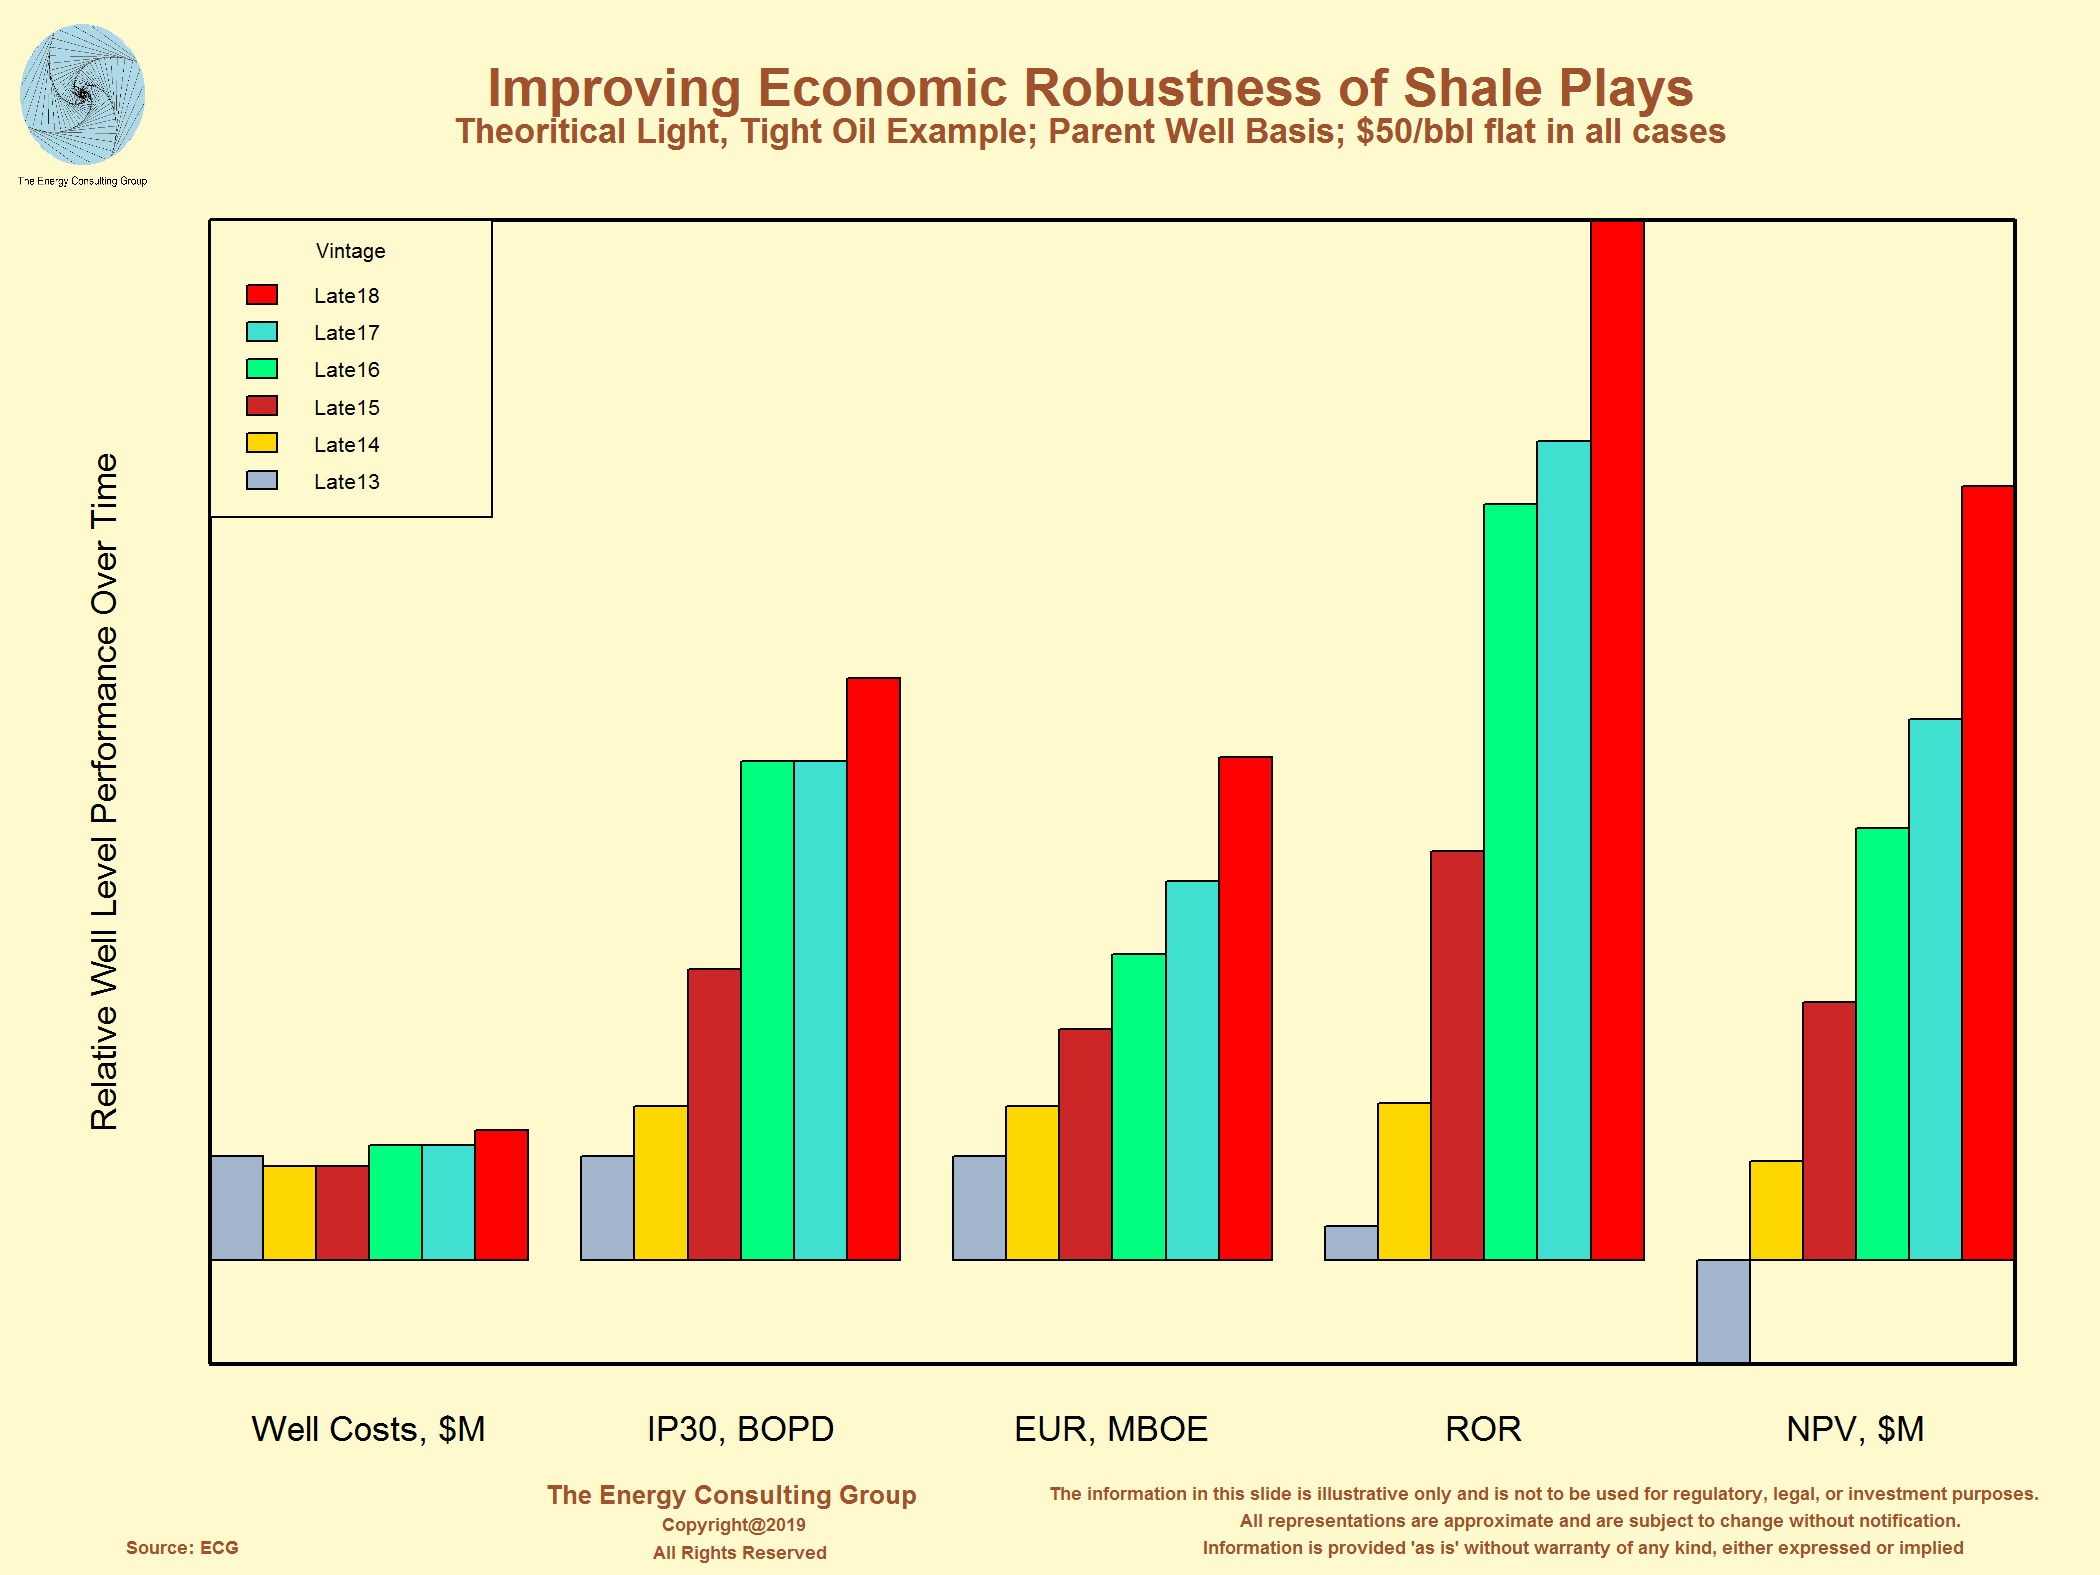
Another point to make is that the economics can vary considerably from play-to-play, or even within a play. The next three slides, which are derived from our proprietary economic evaluation program, EVAL, illustrate this point, and also show the sensitivity of some of the more prominent plays to variations in oil and gas pricing. The final 2 slides in this section are supply curves (one for North America natural gas plays and another for North American oil plays) generated using the EVAL economic analysis program. These show not only approximate volumes of supply at different price points, but also how the economics of different play types compare to one another.
Before Income Tax (BFIT) ROR Sensitivity for Selected
North American Oil Shale Plays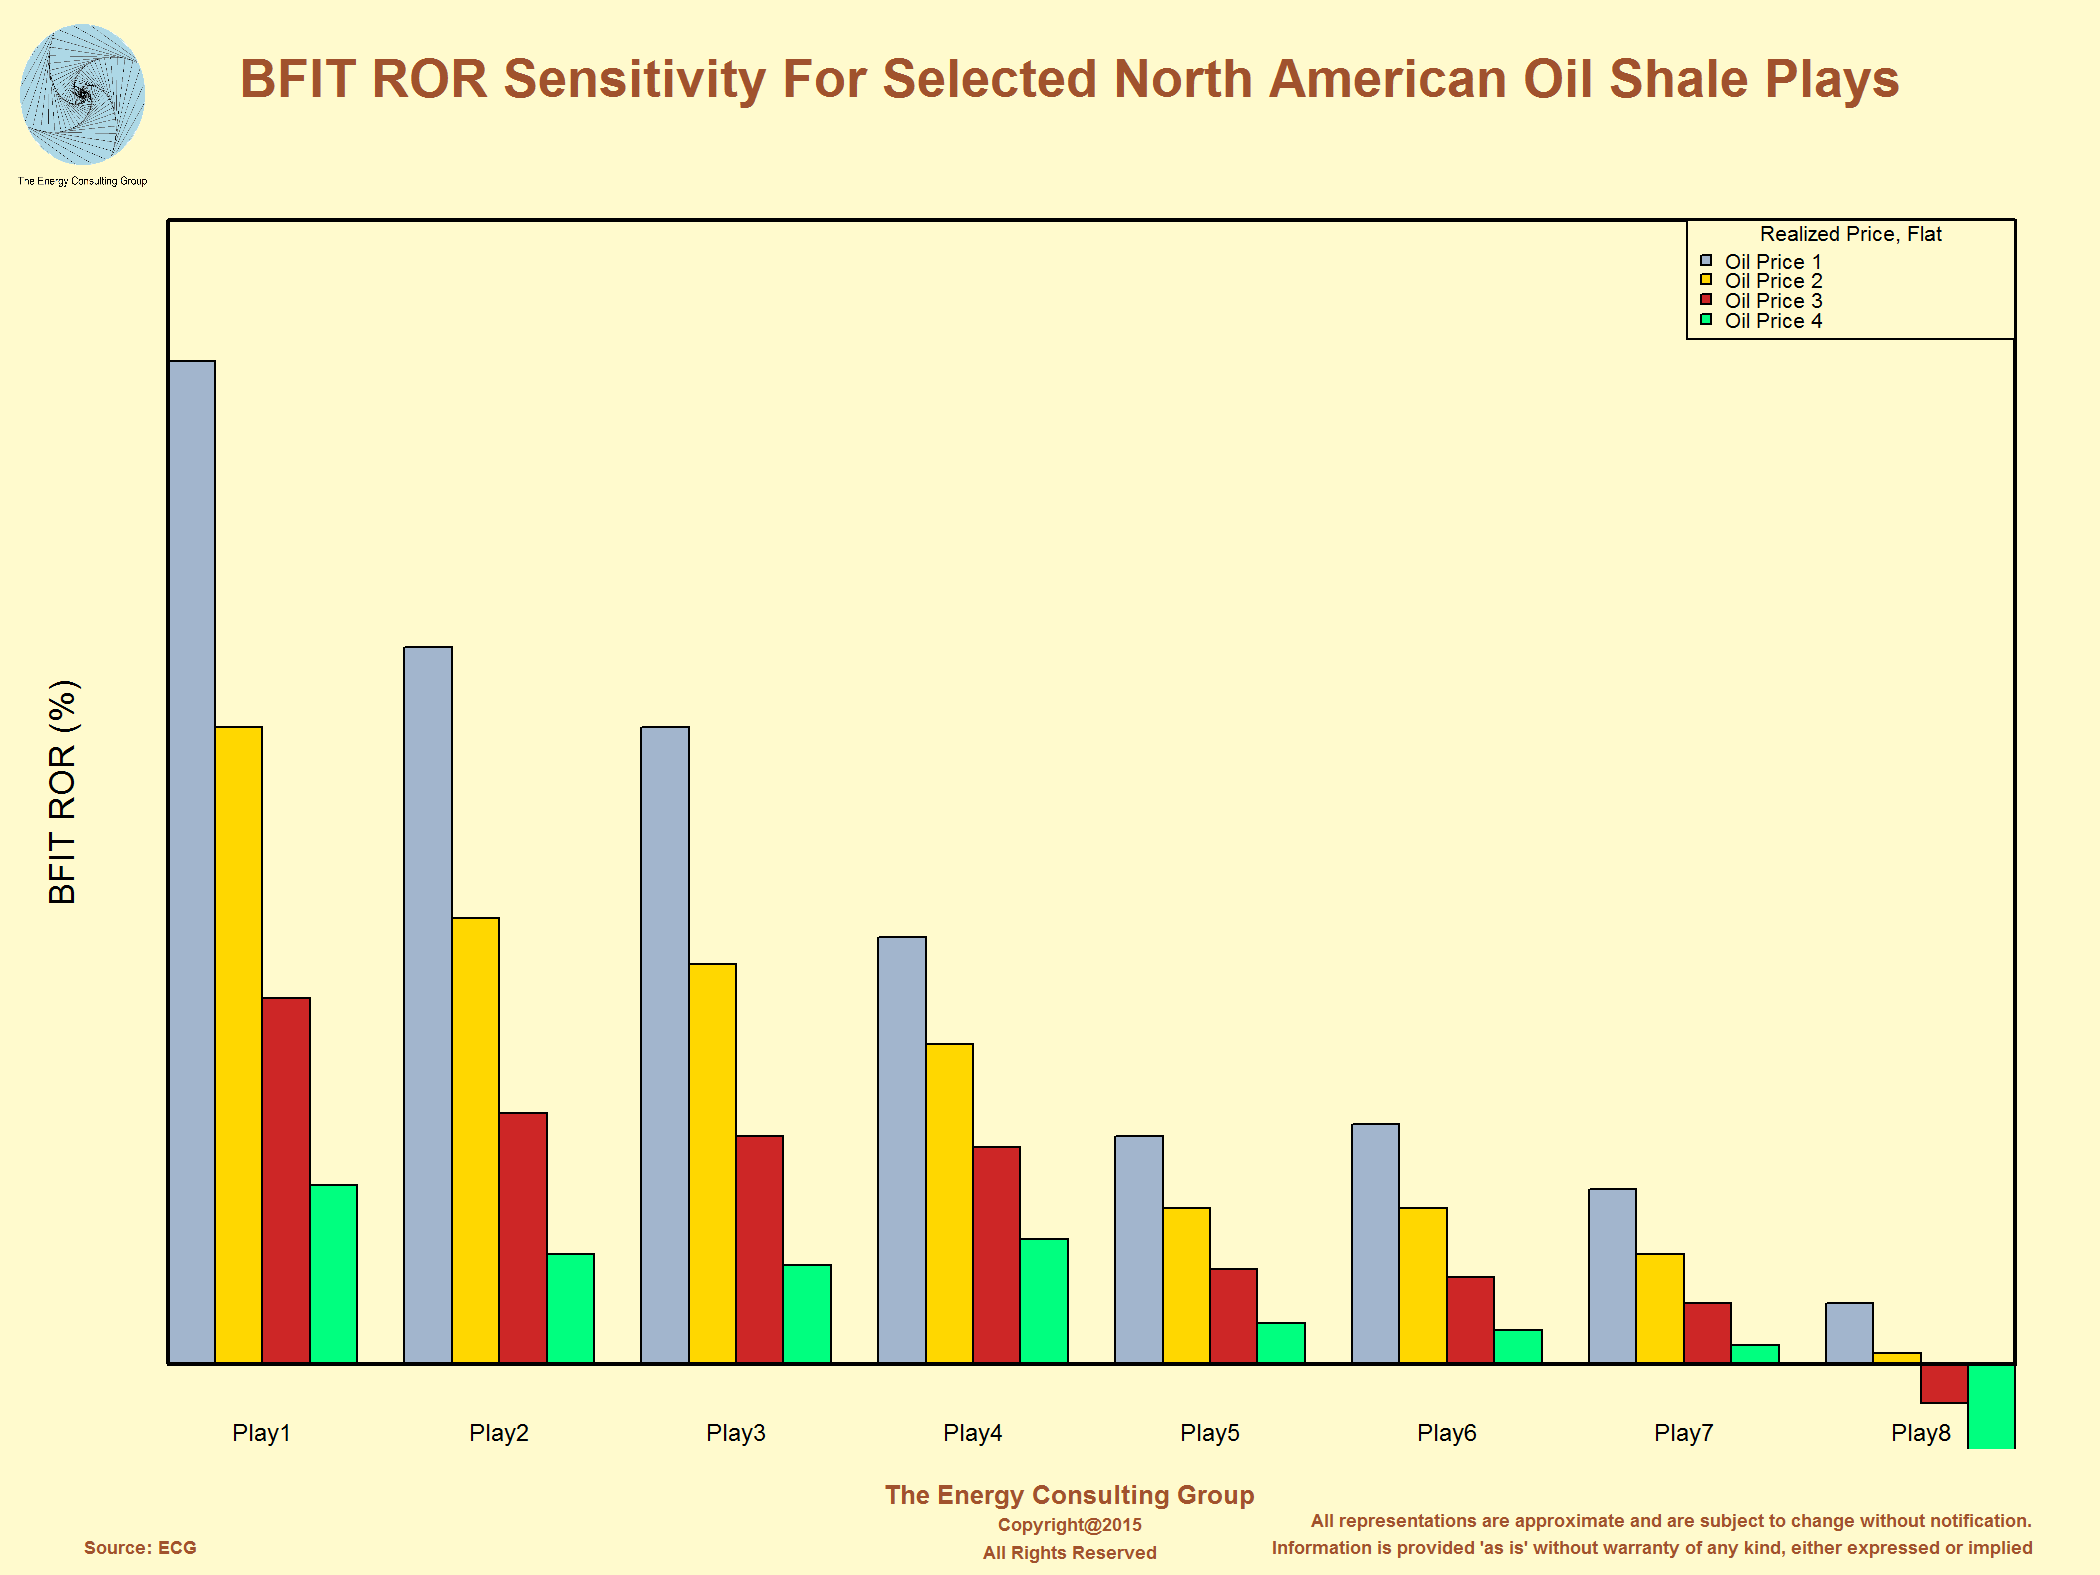 Click on the image for higher resolution version of the map. |
Before Income Tax (BFIT) ROR Sensitivity for Selected
North American Wet Gas Shale Plays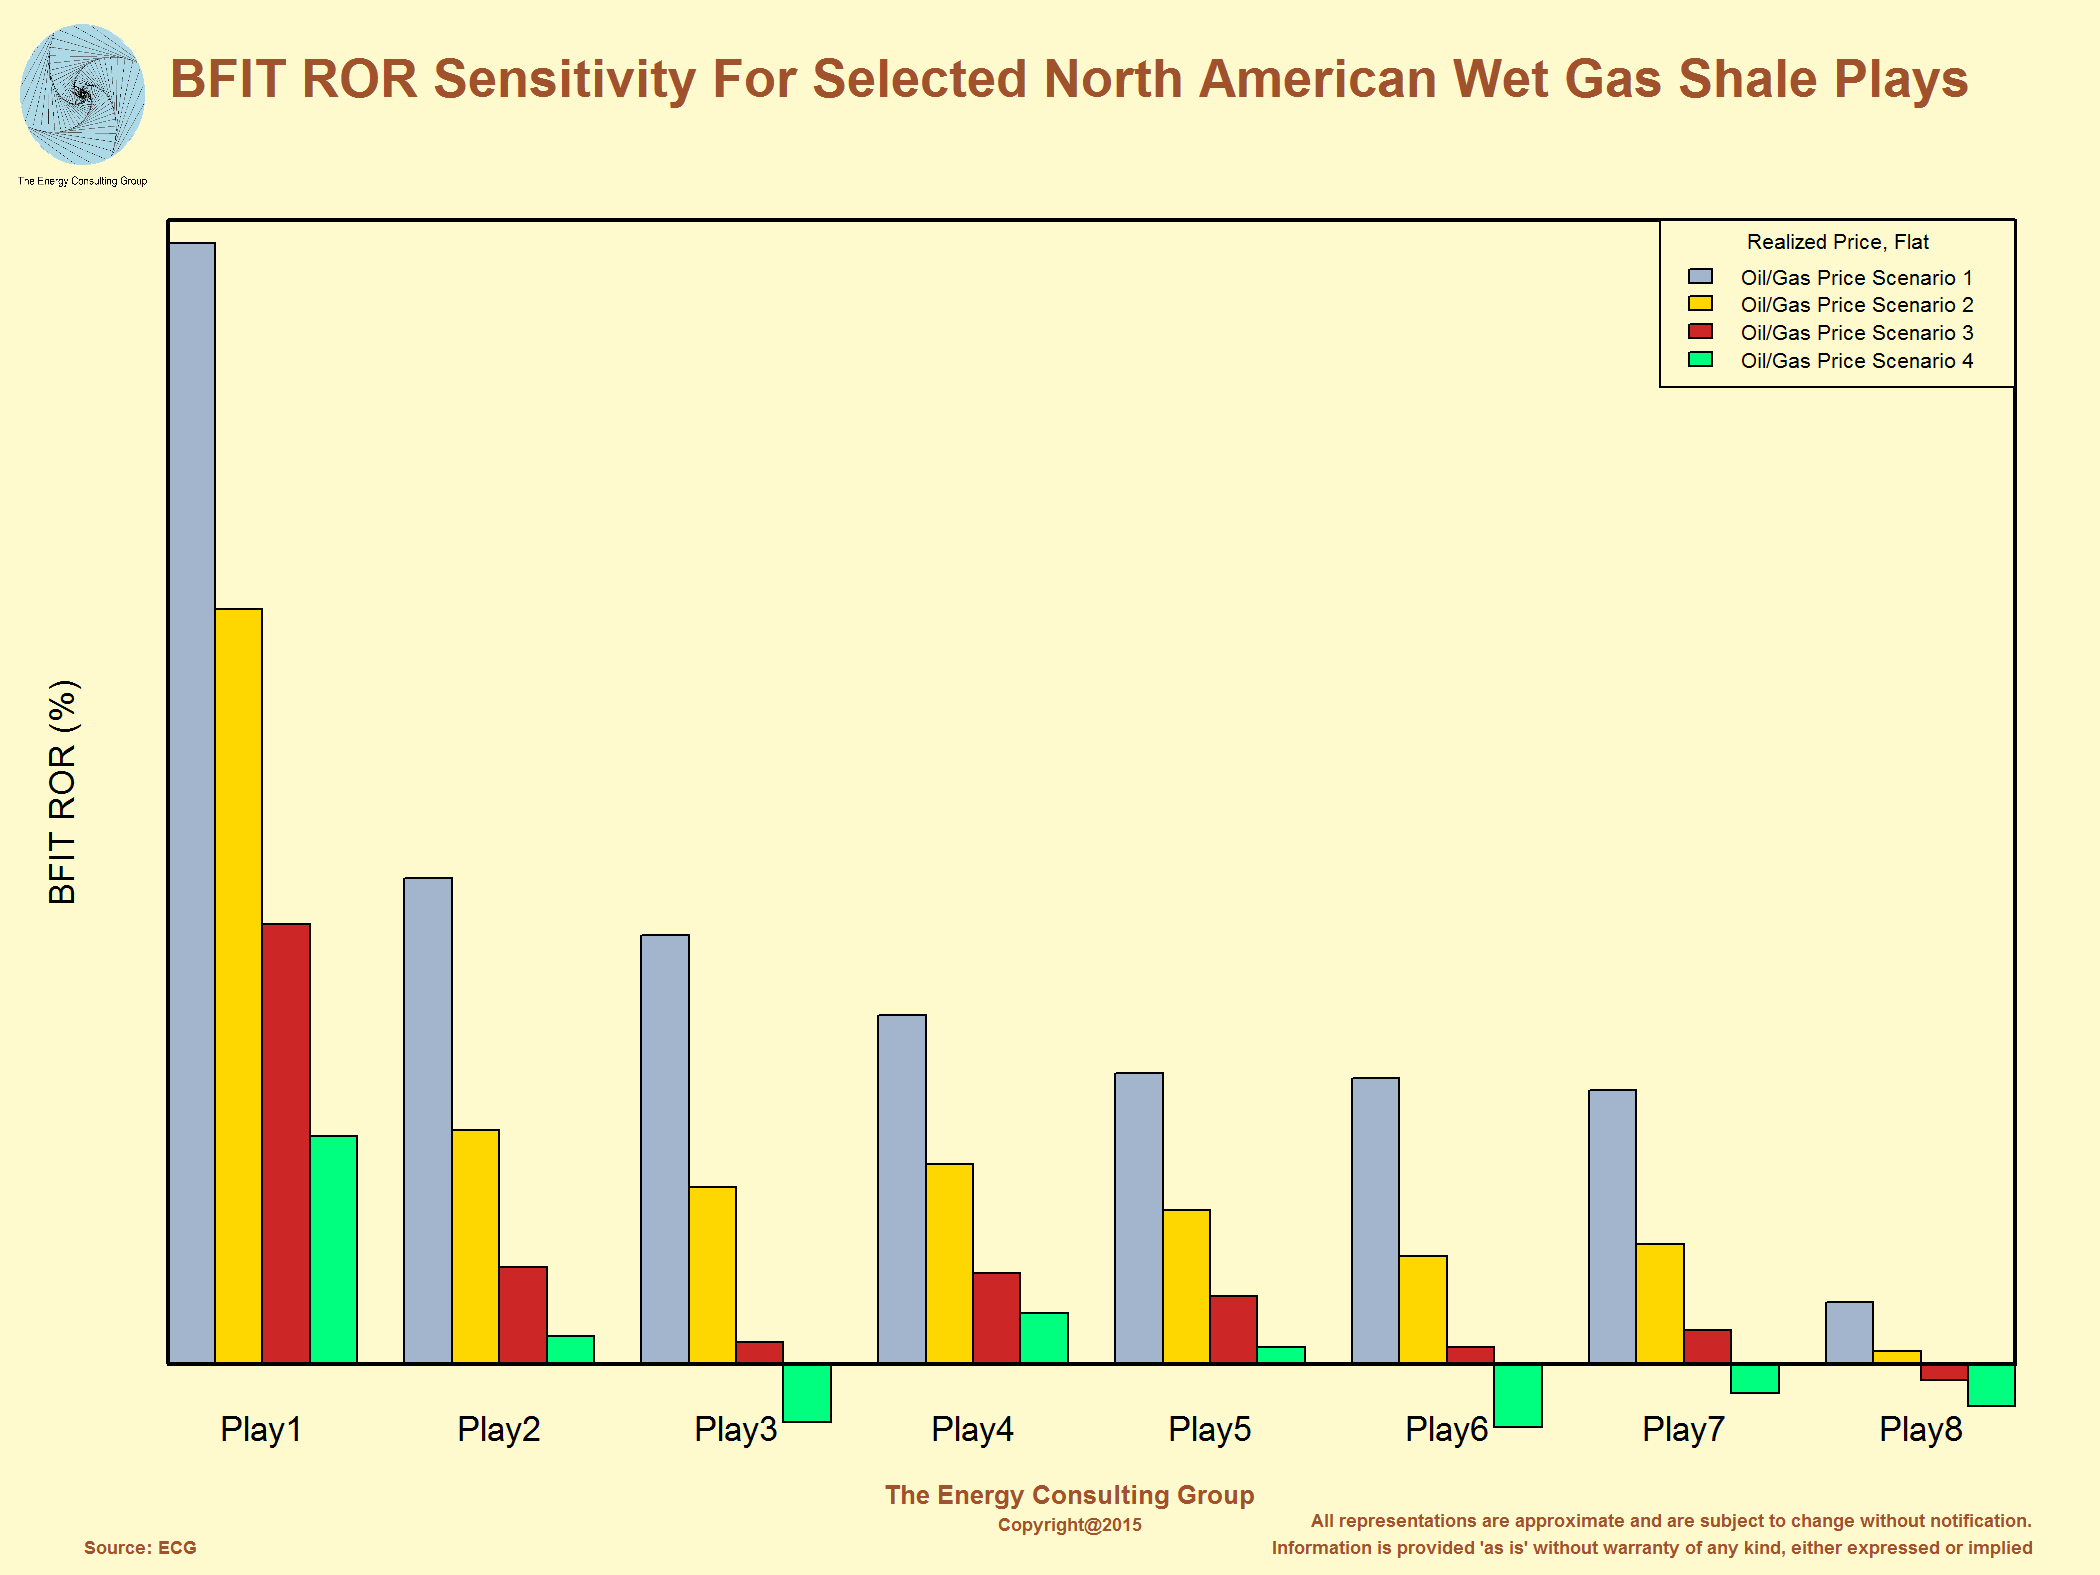 Click on the image for higher resolution version of the map. |
Before Income Tax (BFIT) ROR Sensitivity for Selected
North American Dry Gas Shale Plays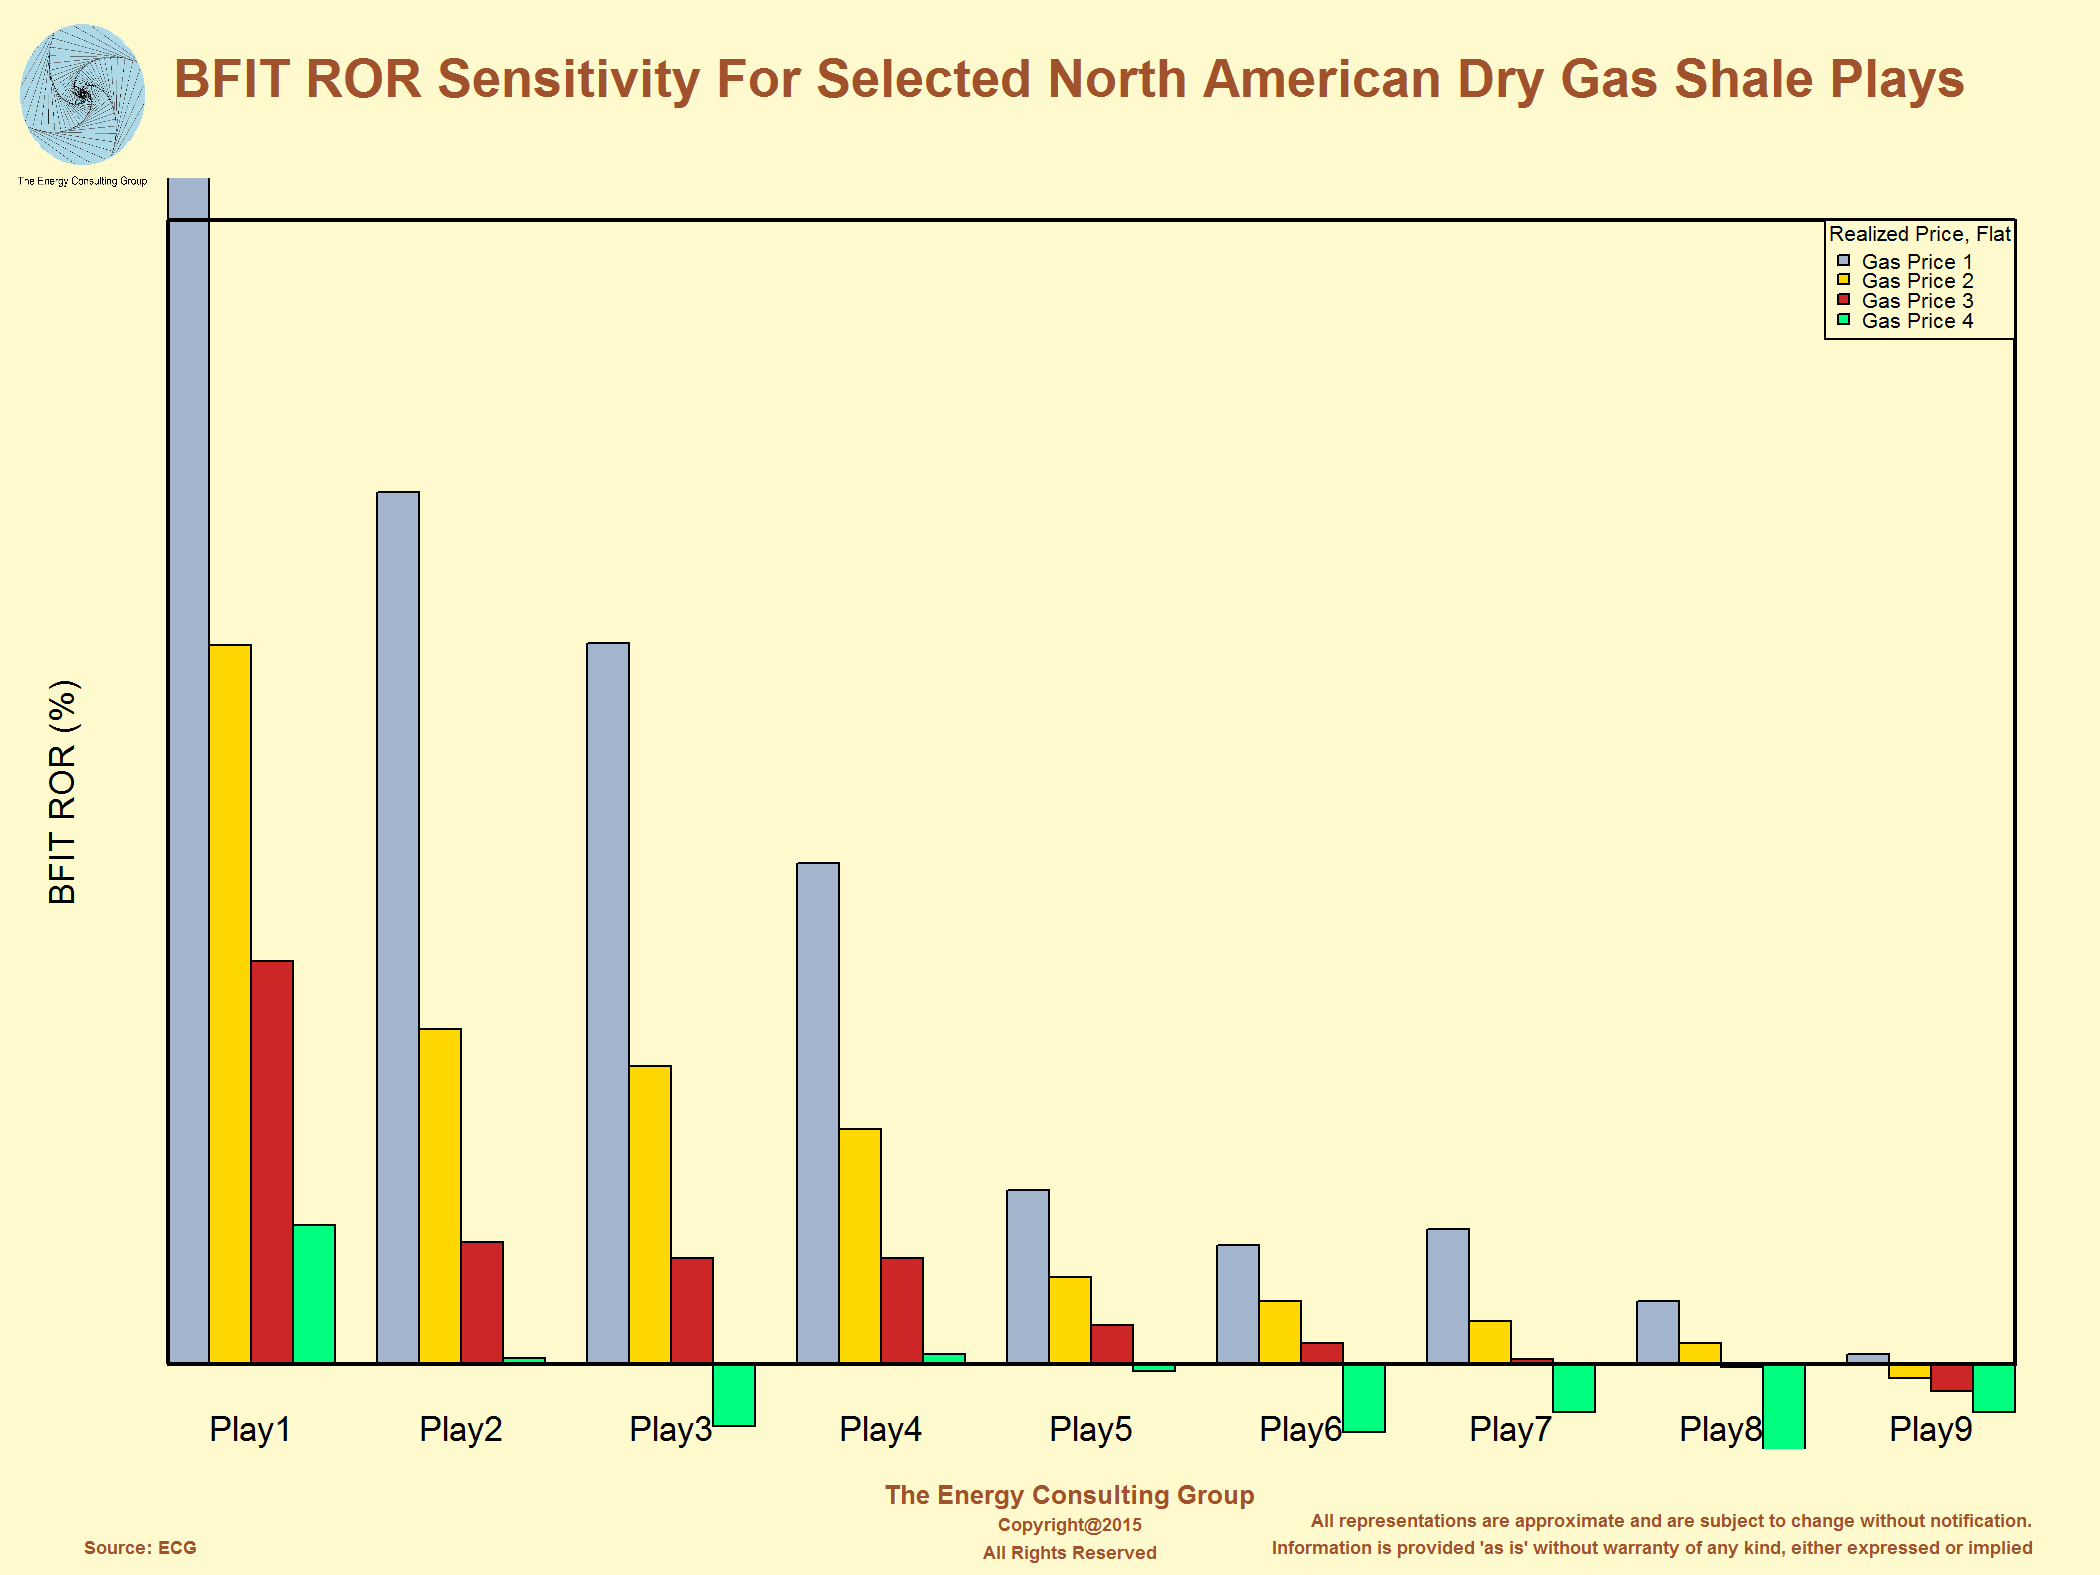 Click on the image for higher resolution version of the map. |
North American Natural Gas Supply Curve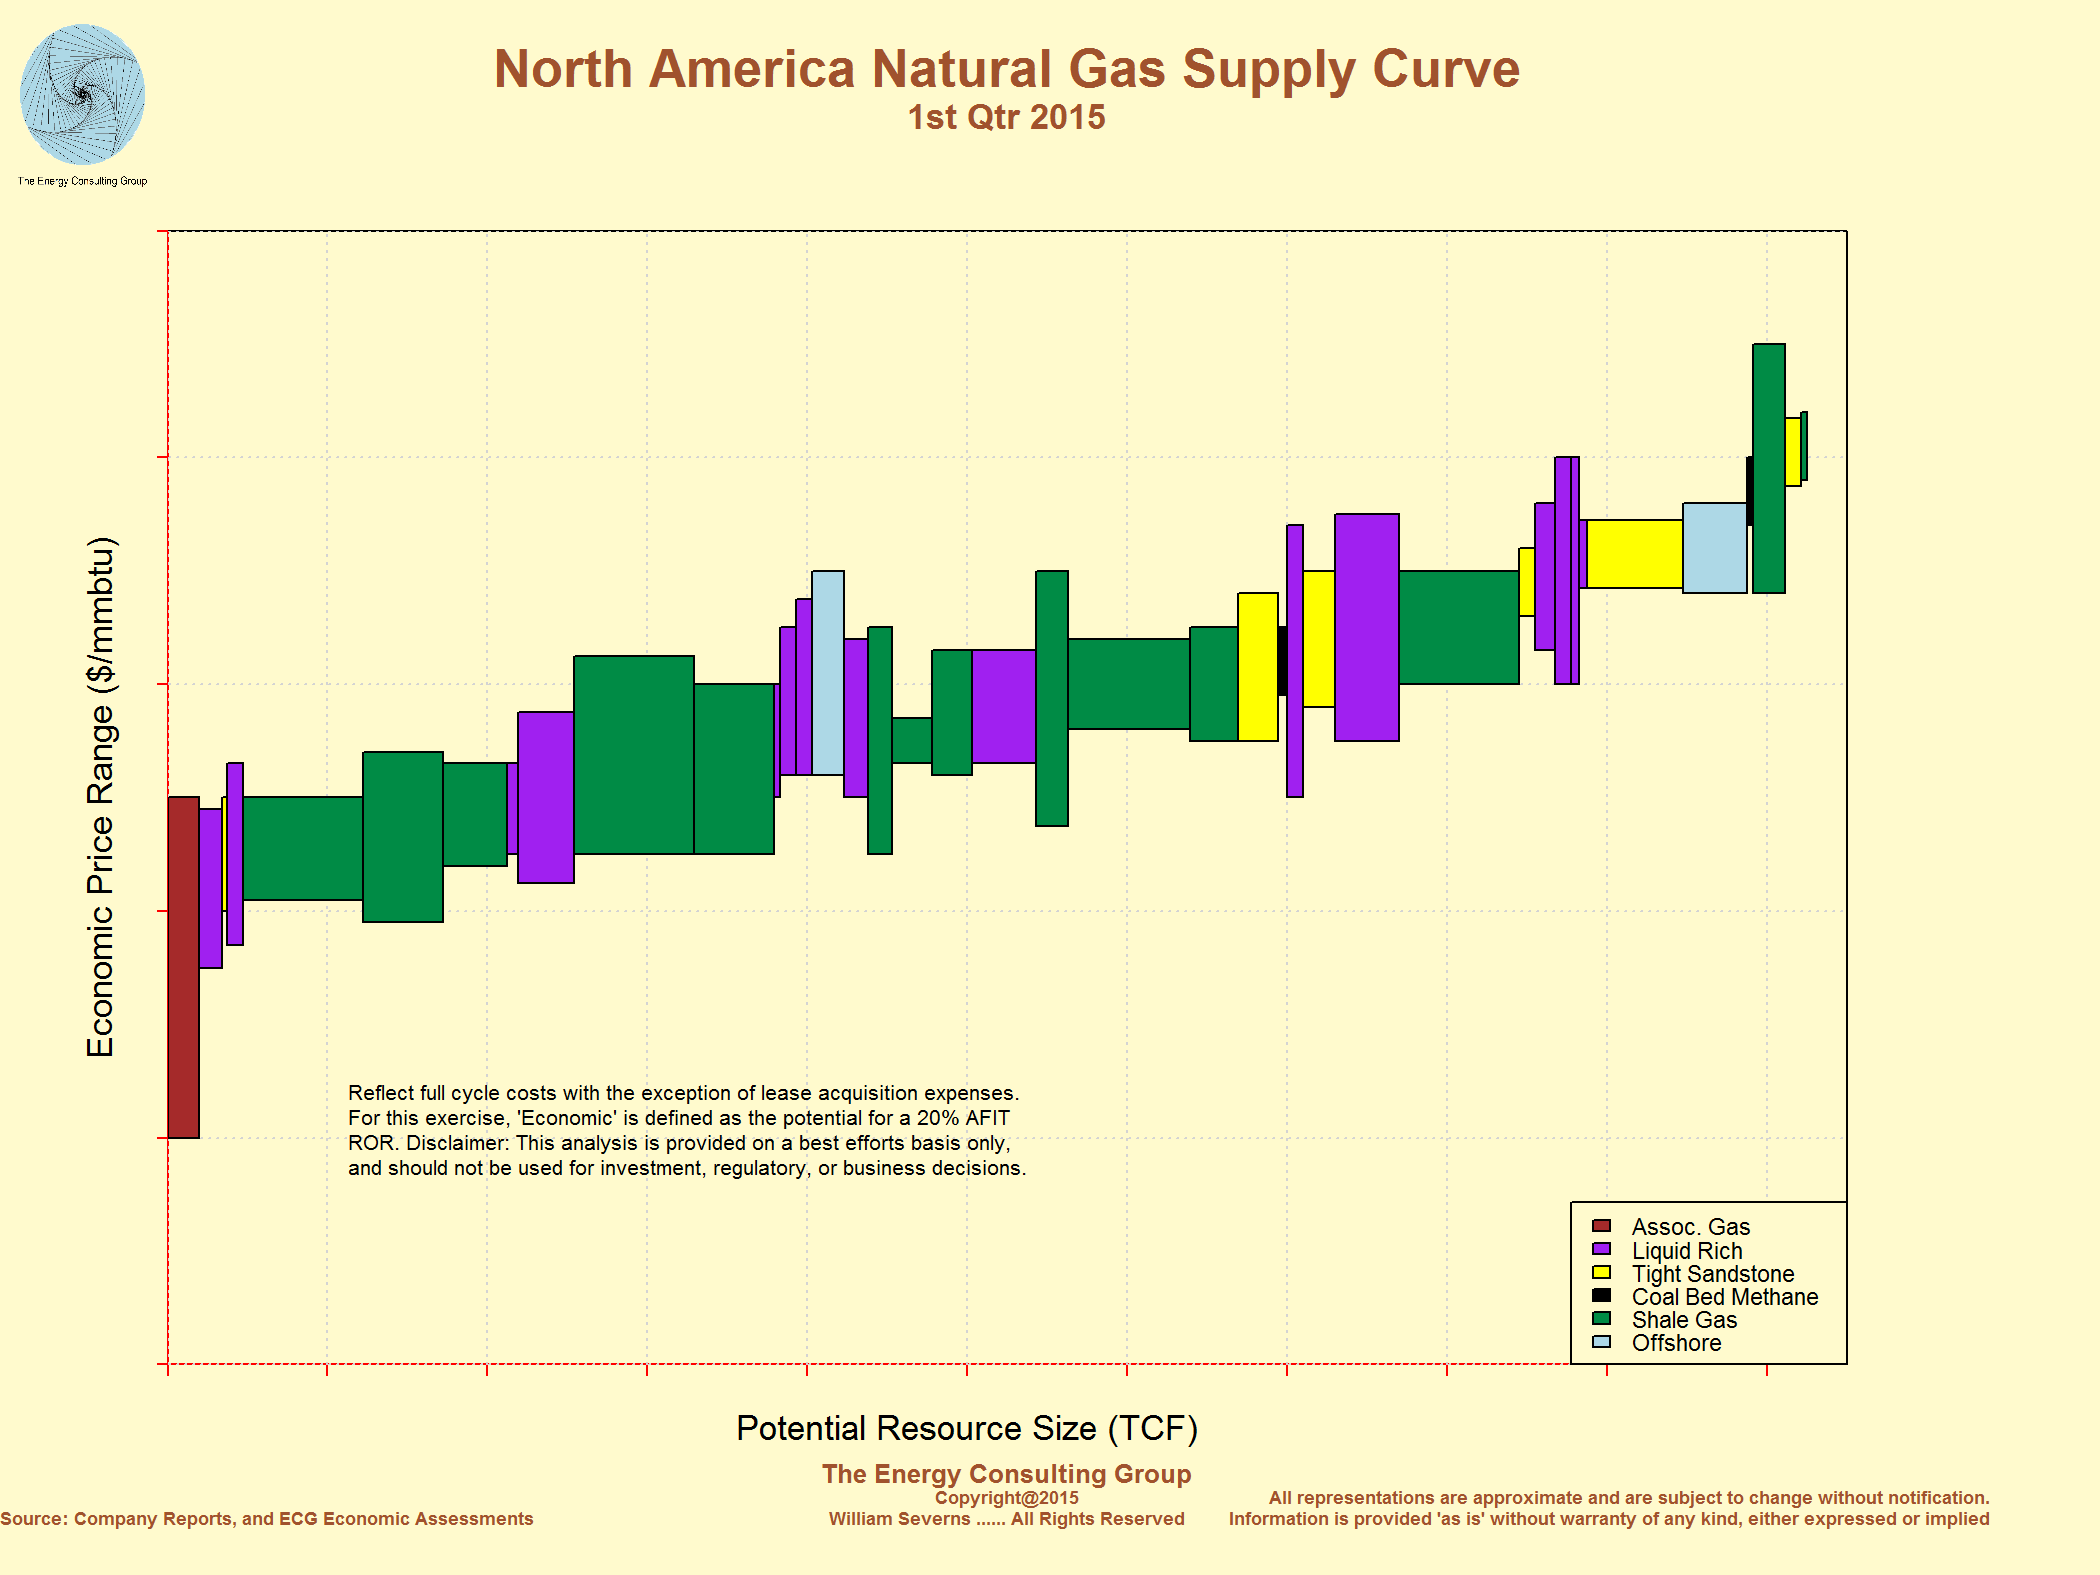 Click on the image for higher resolution version of the map. |
North American Oil Supply Curve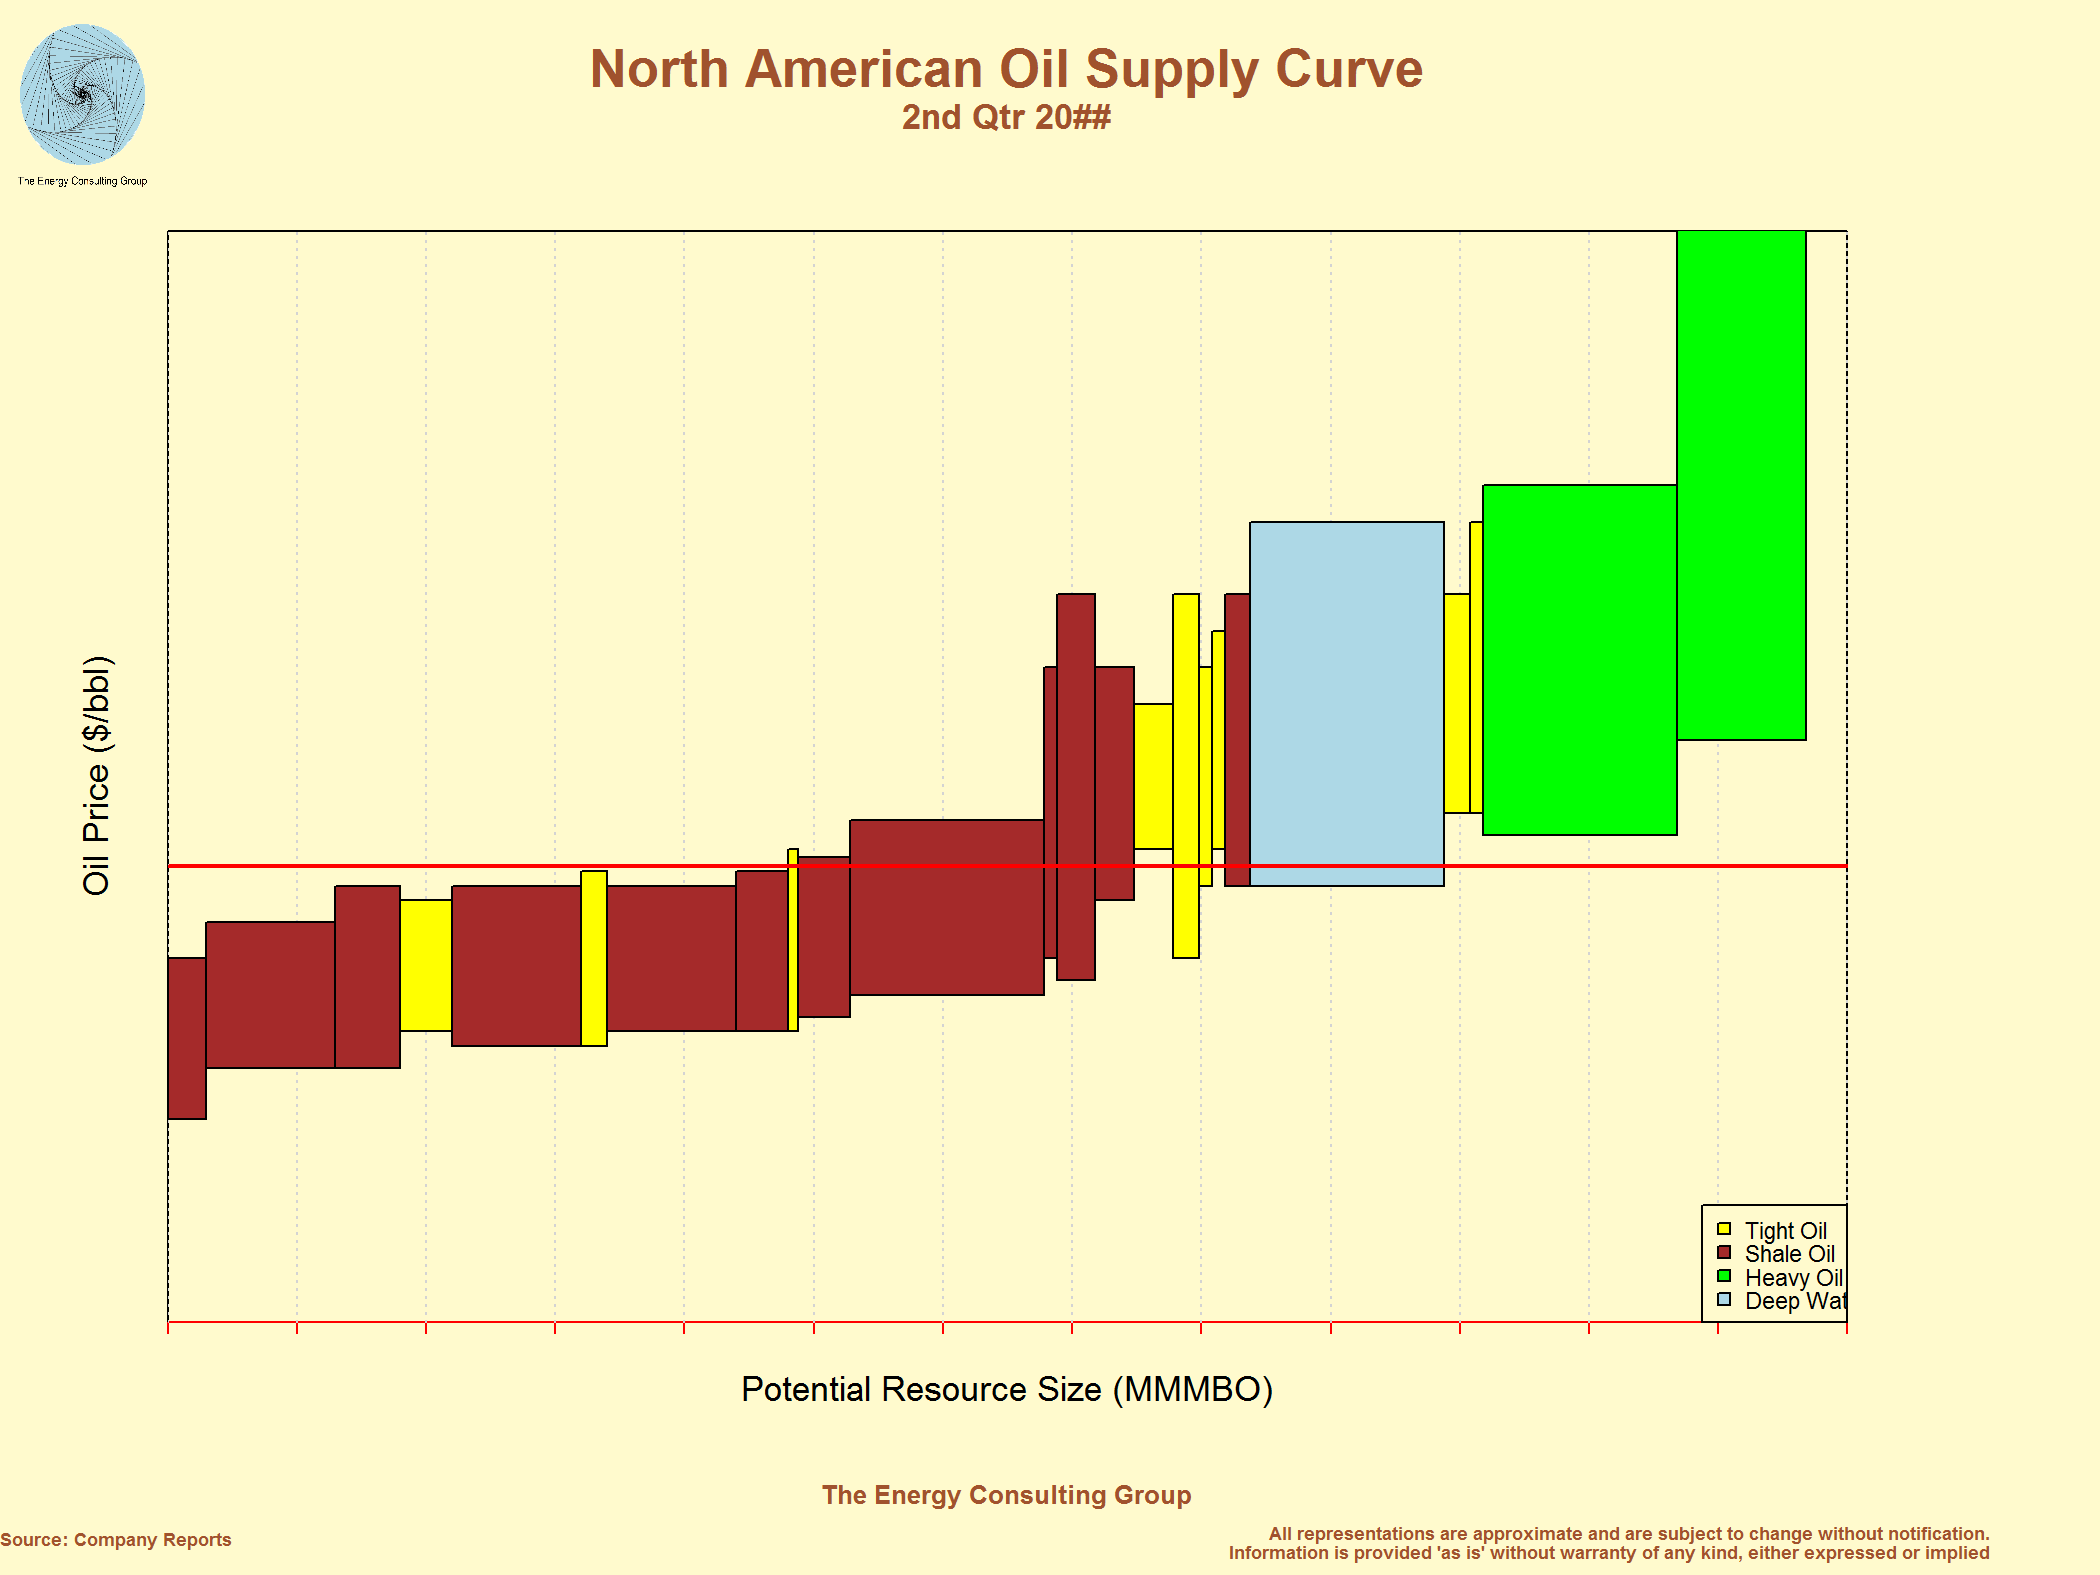 (for a pre-2018 period) |
Return to Web Page Index
|
E&P News and Information Scandinavian International and National International Energy
Agency Department of Trade and Norwegian
Petroleum Ministry of Industry
and E&P Project Information |
|---|