The Energy Consulting Group
Management consultants for upstream oil and gas producers and service companies
|
E&P News and Information Scandinavian International and National International Energy
Agency Department of Trade and Norwegian
Petroleum Ministry of Industry
and E&P Project Information |
|---|
 Click on the Above For Higher Resolution Image |
 Click on the Above For Higher Resolution Image |
 Click on the Above For Higher Resolution Image |
 Click on the Above For Higher Resolution Image |
| Australian Oil and Gas Overview | |
|
Australia: Oil and Gas Overview Map 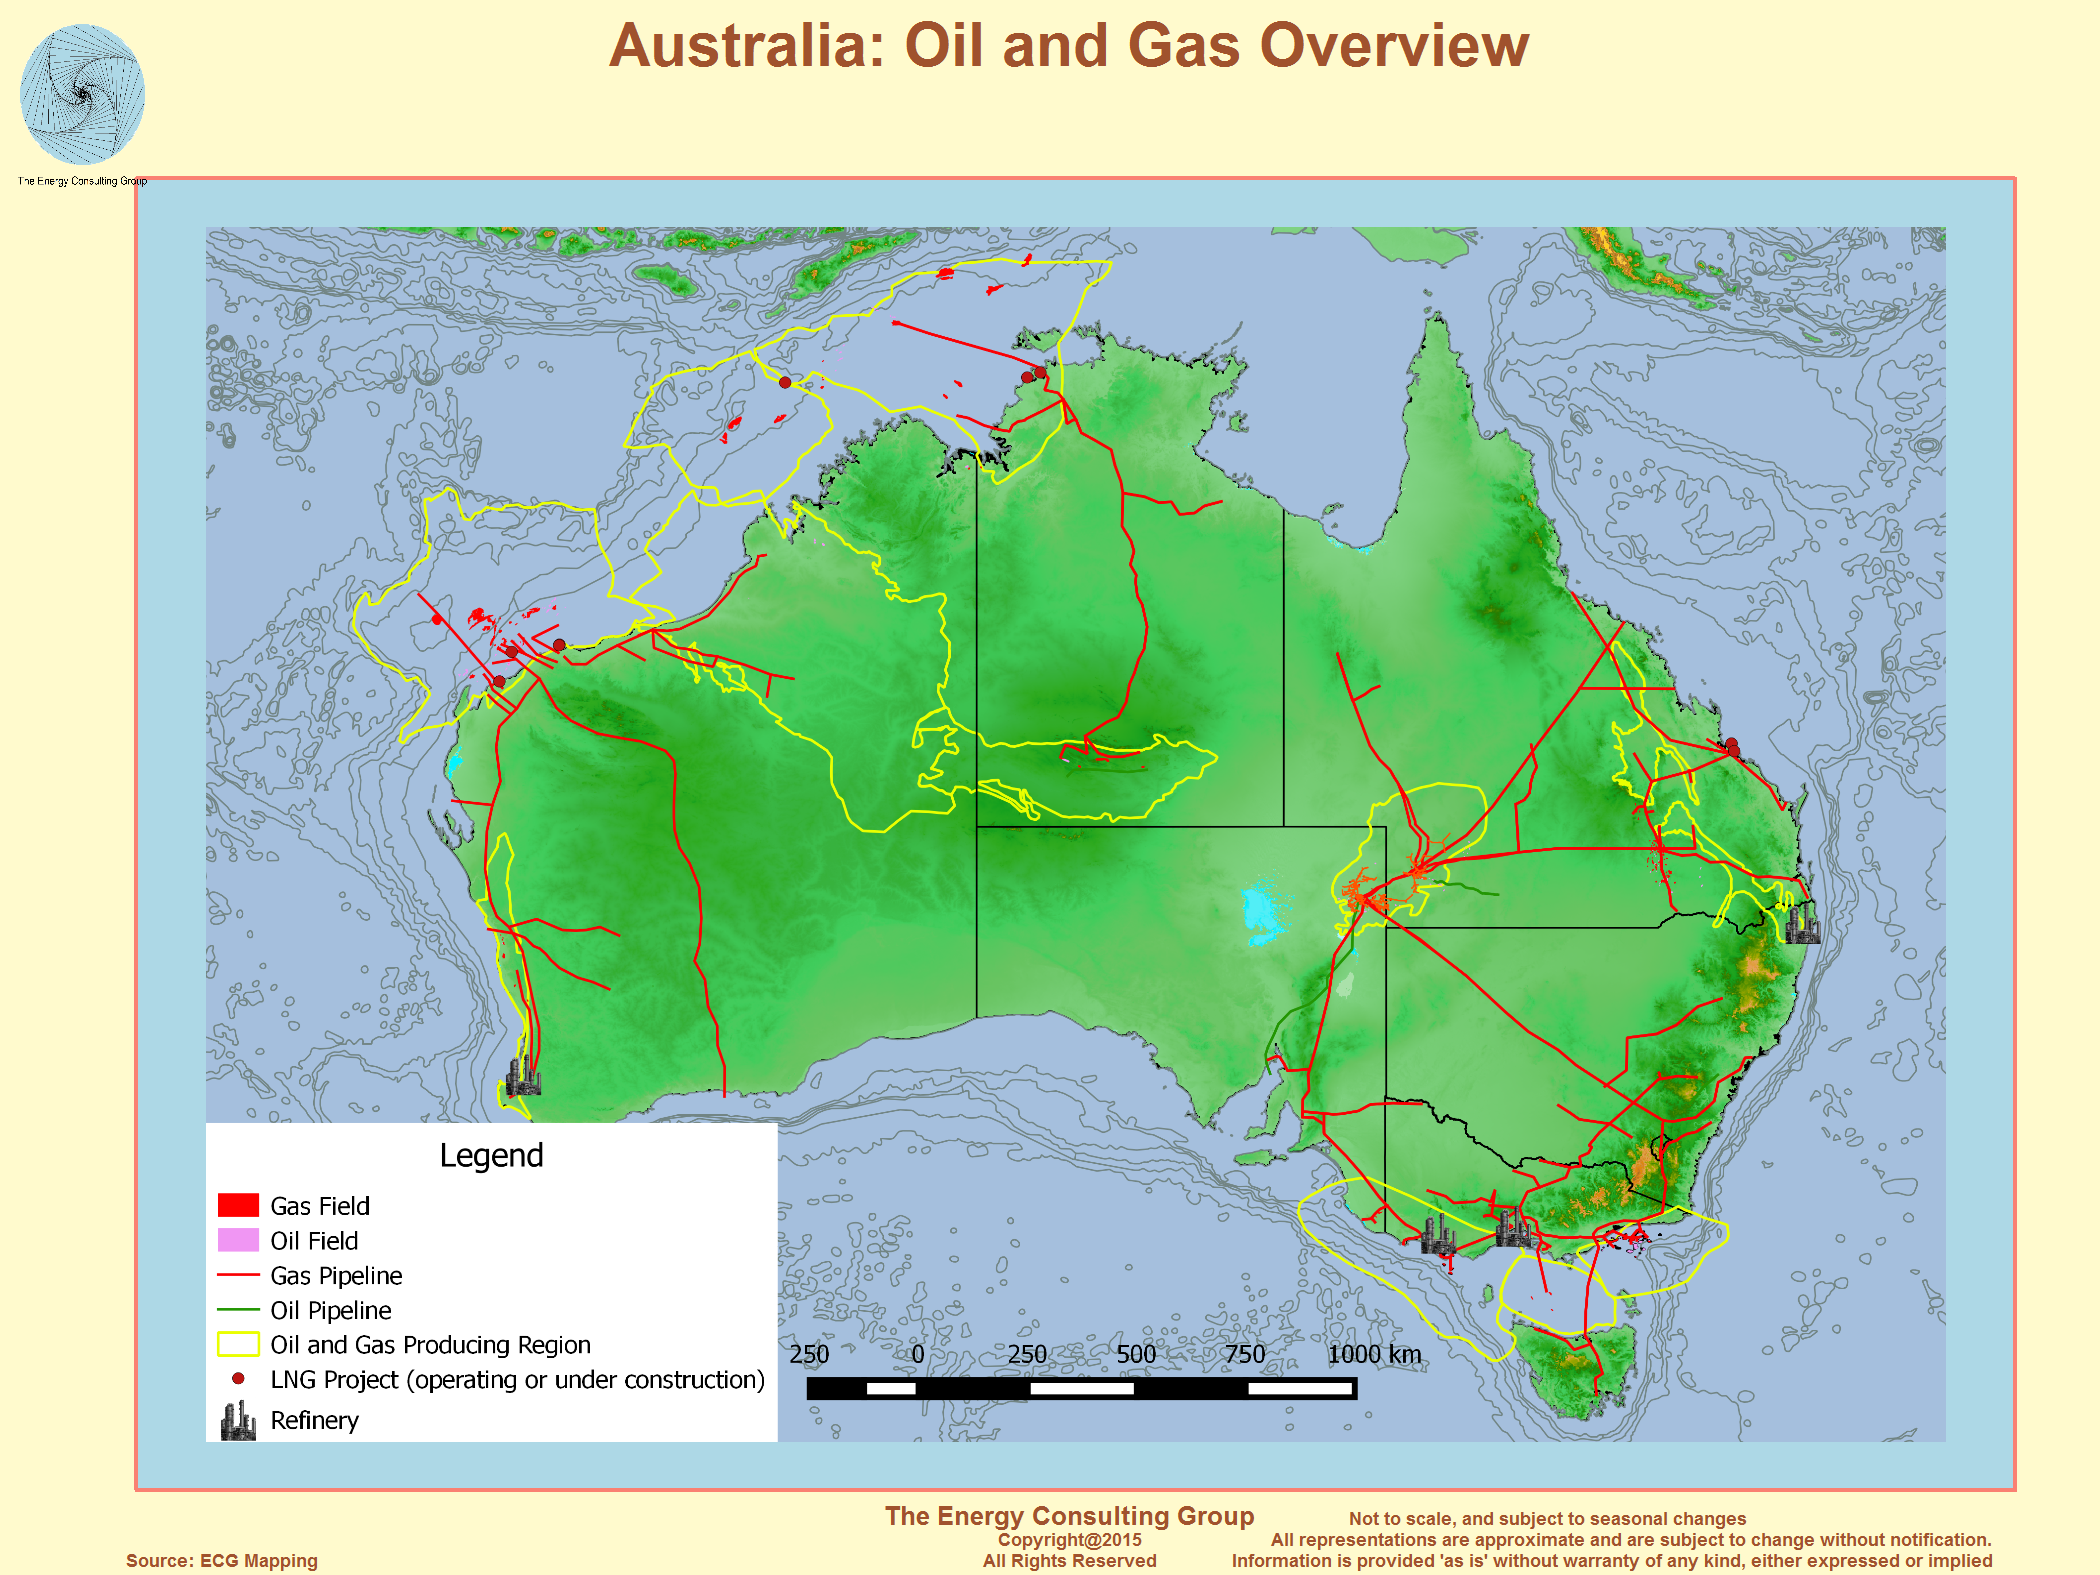 Click on the Above For Higher Resolution Image |
Ichthys Offshore Field and LNG Development Project Click on the Above For Higher Resolution Image |
Australia Gas Production and Reserves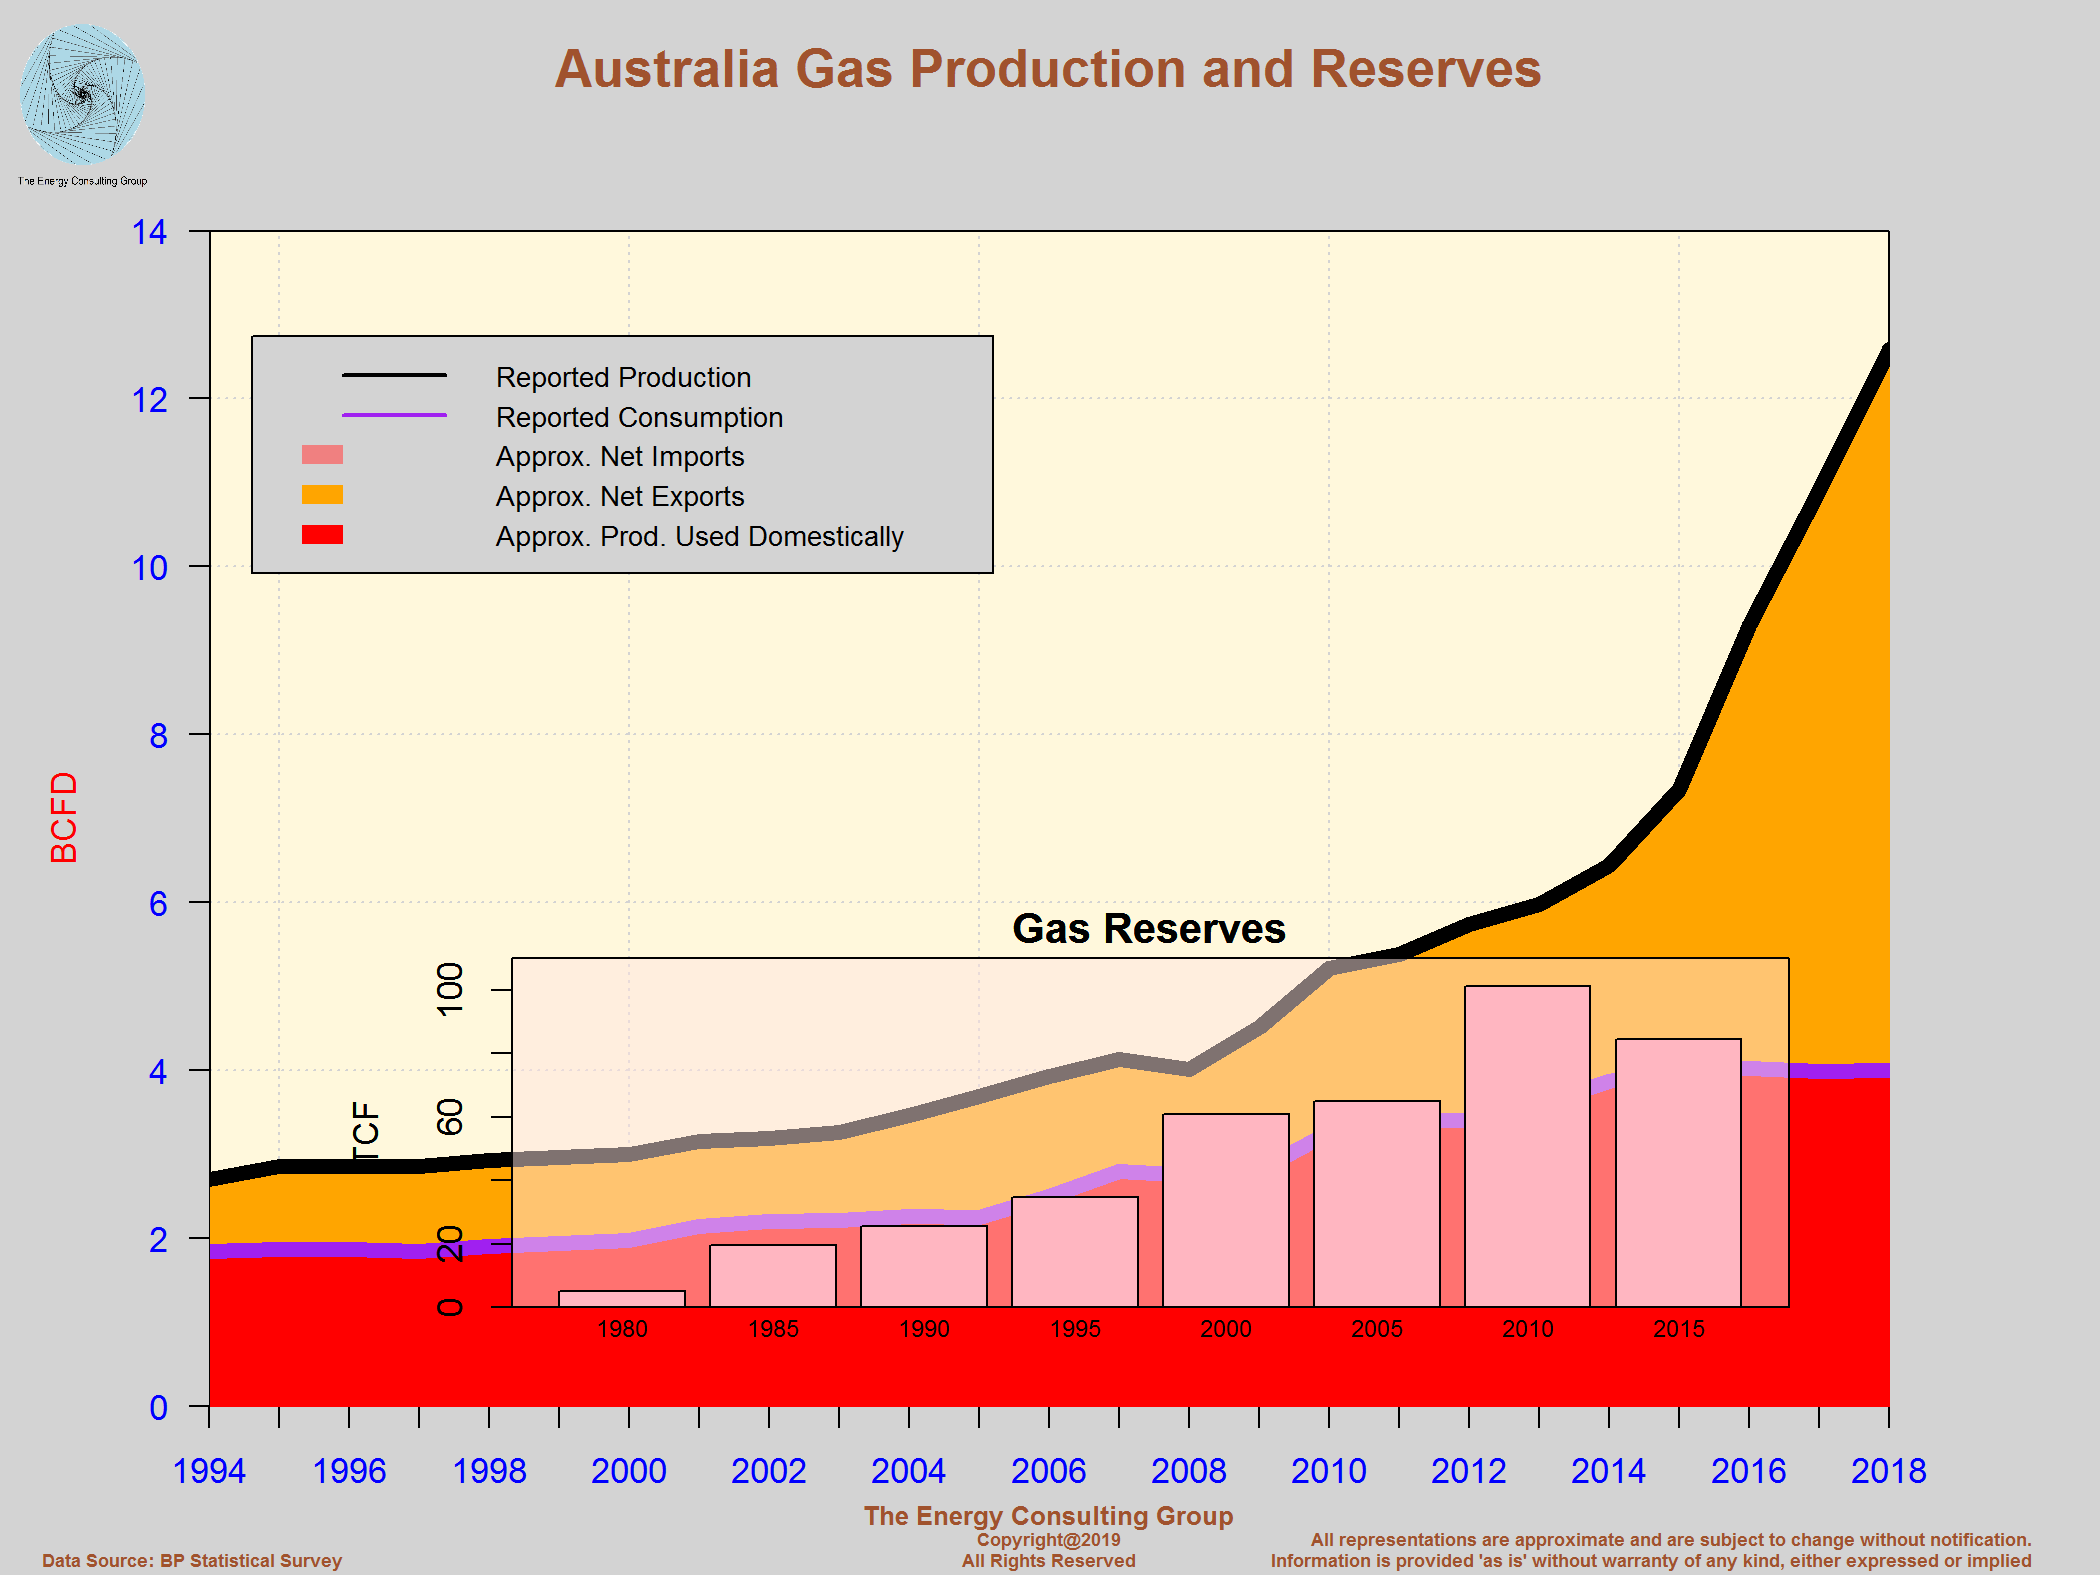 Click on the Above For Higher Resolution Image |
Australia Oil Production and Reserves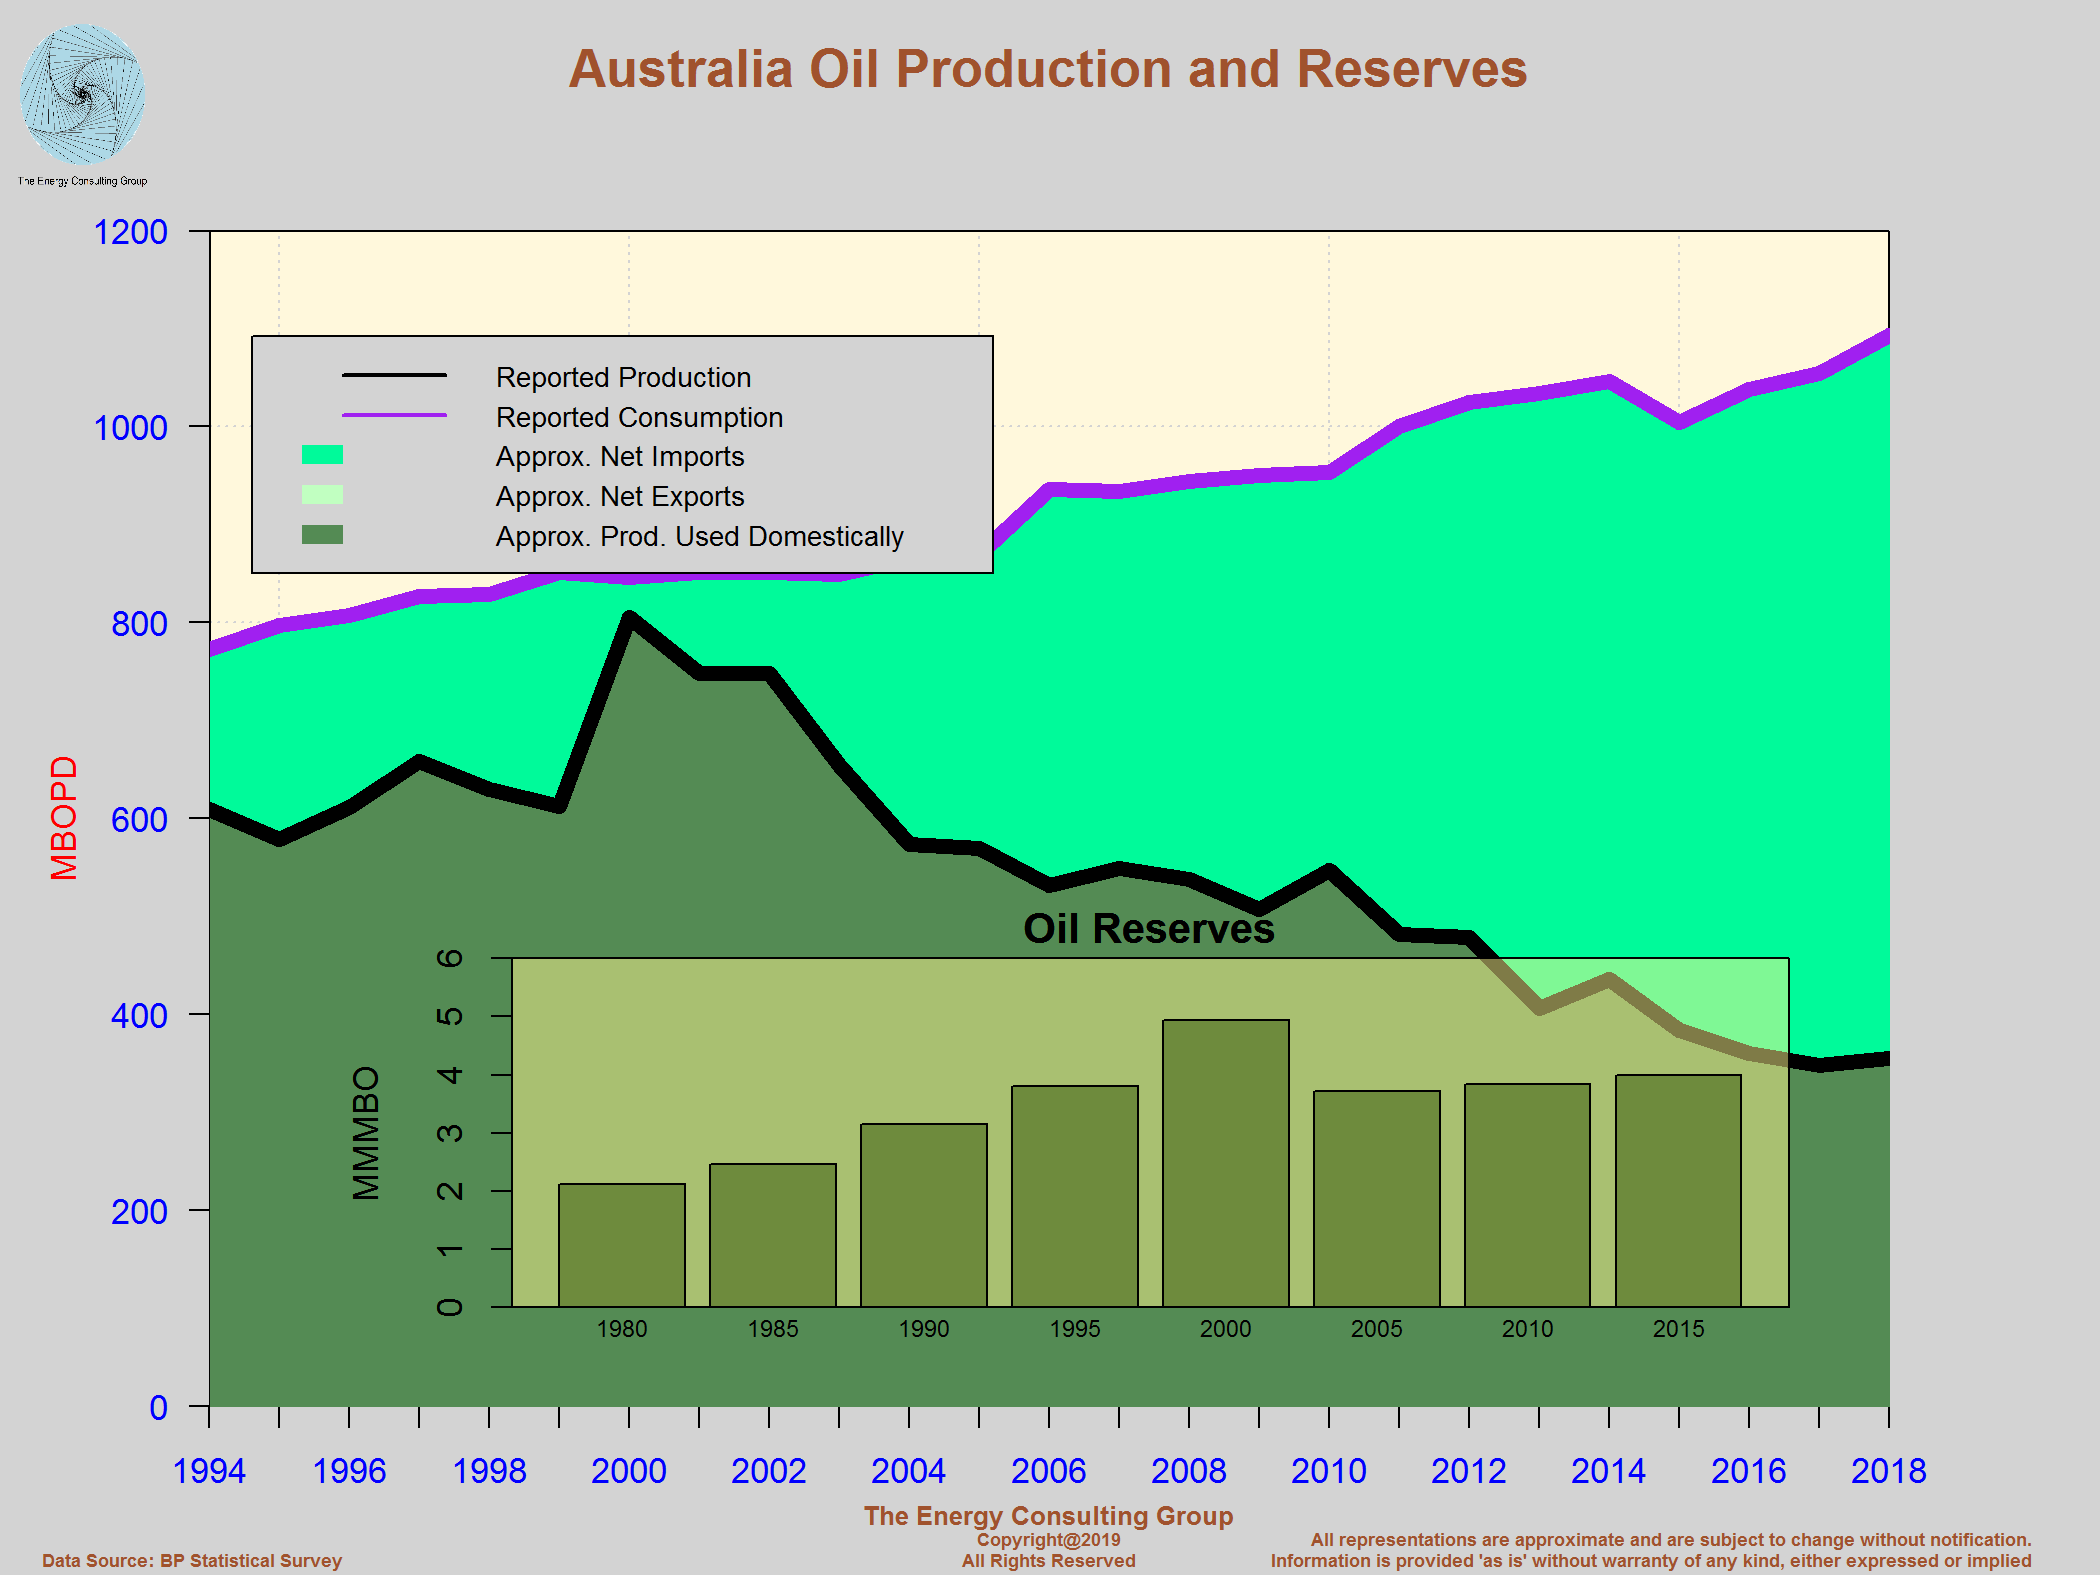 Click on the Above For Higher Resolution Image |
Australian Gas Resource Potential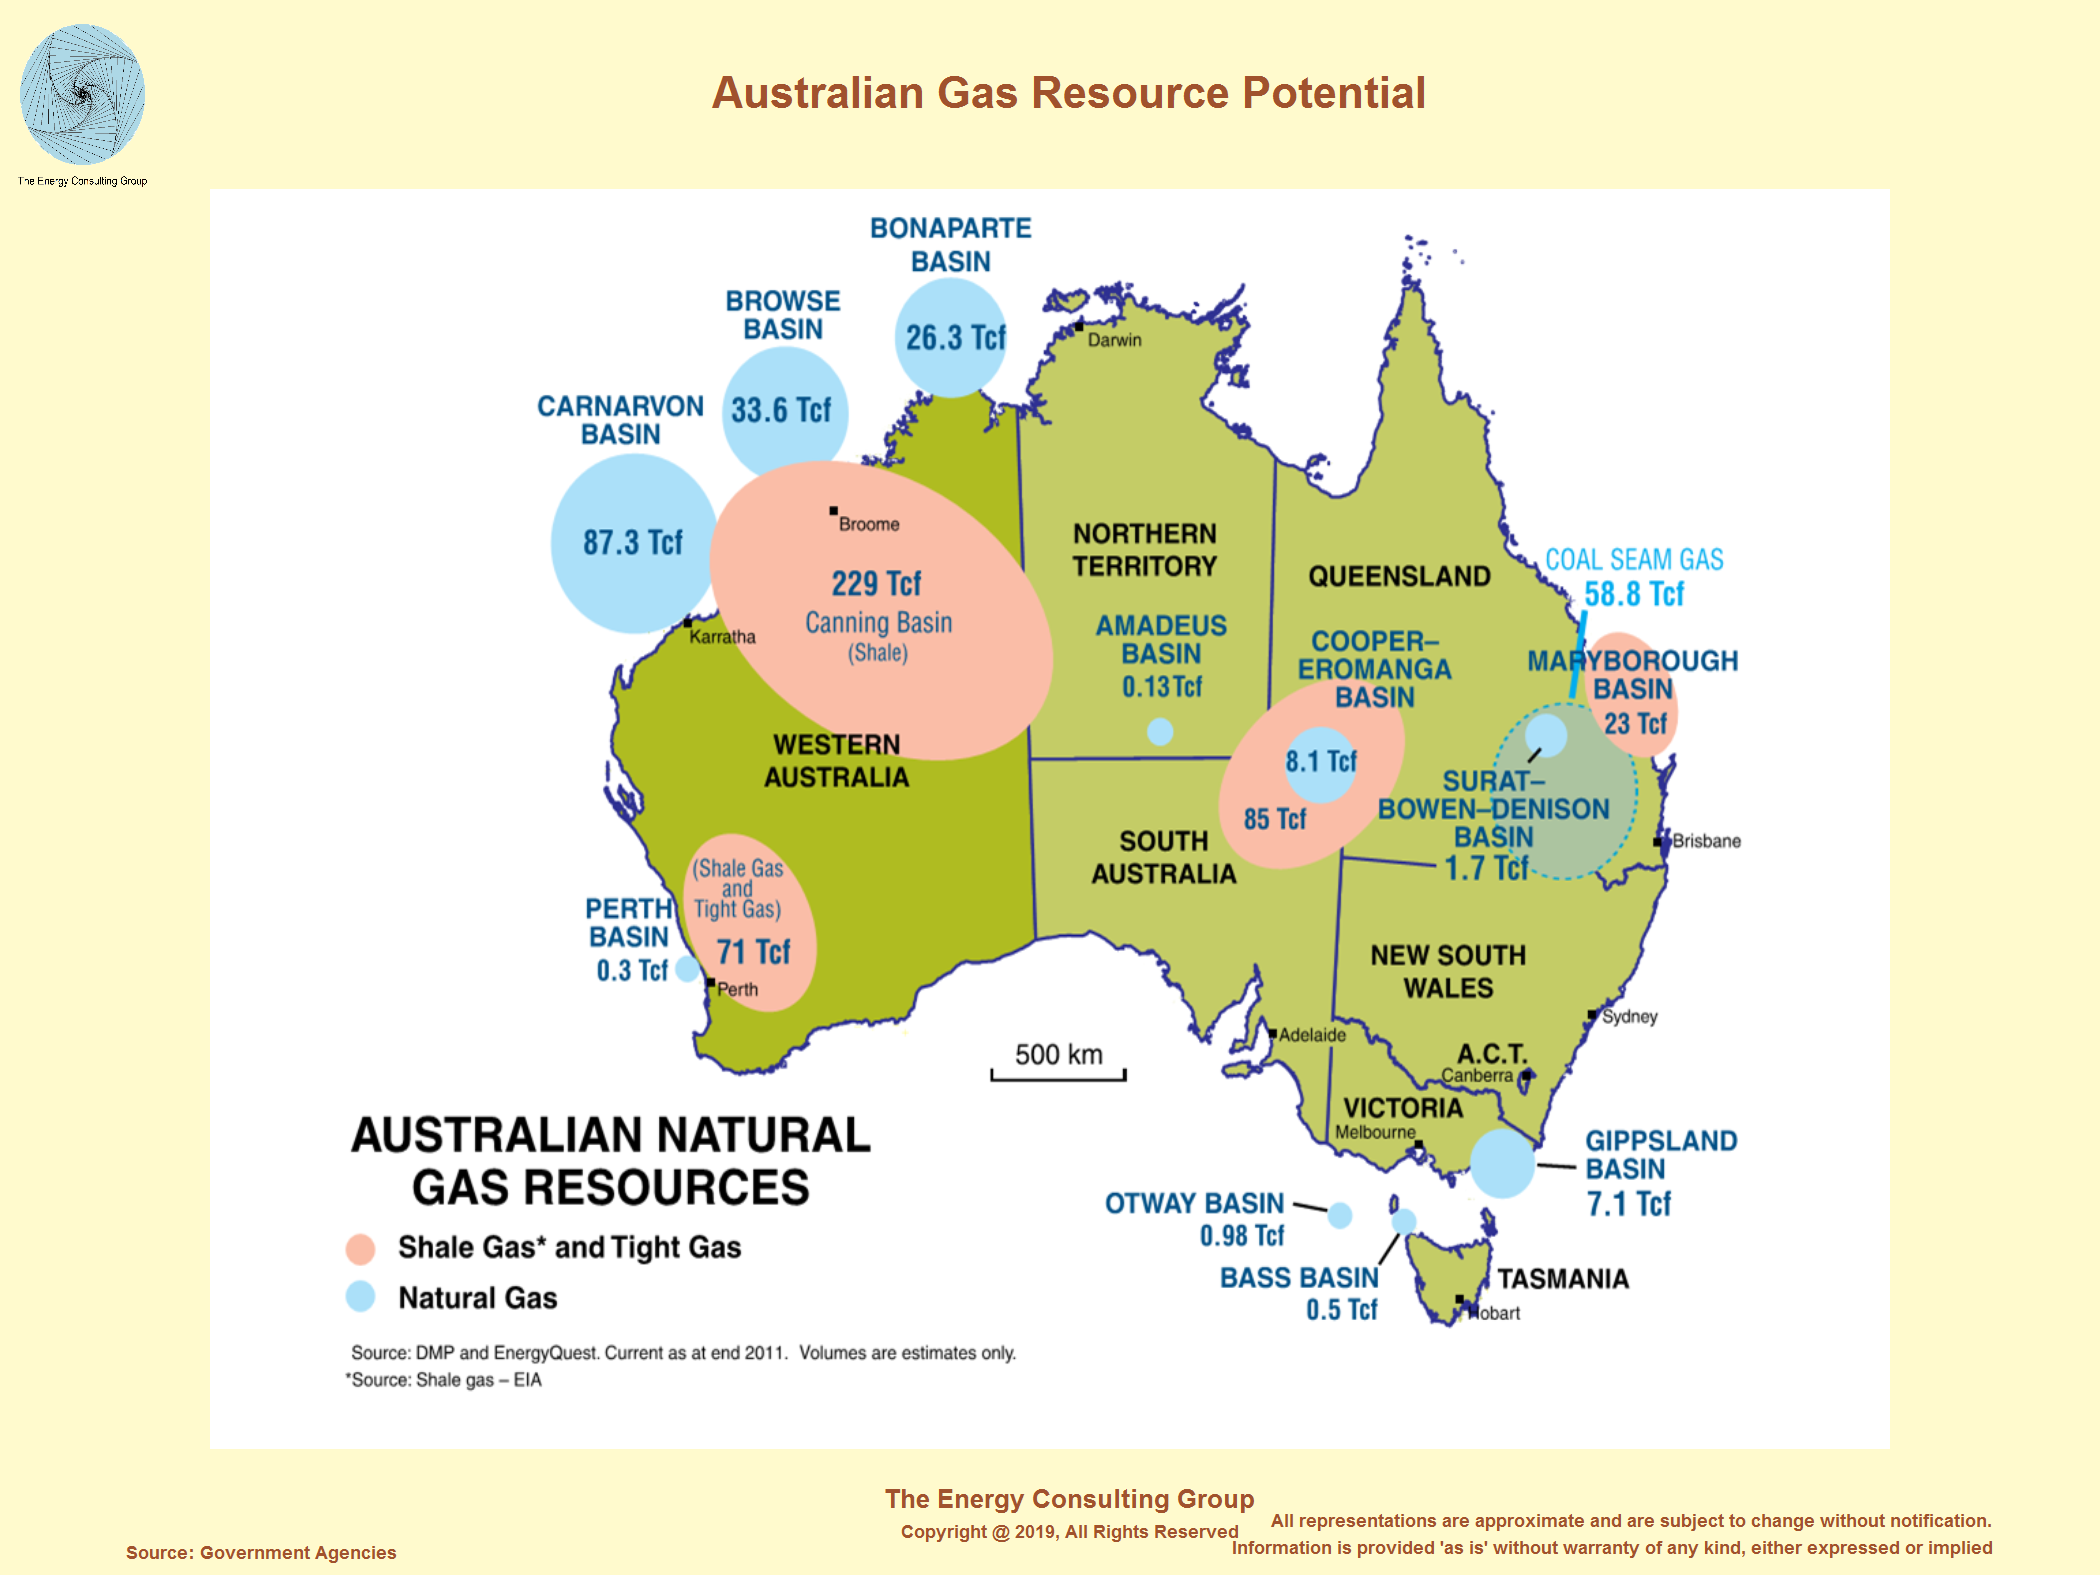 |
Australian Oil and Gas Well Distribution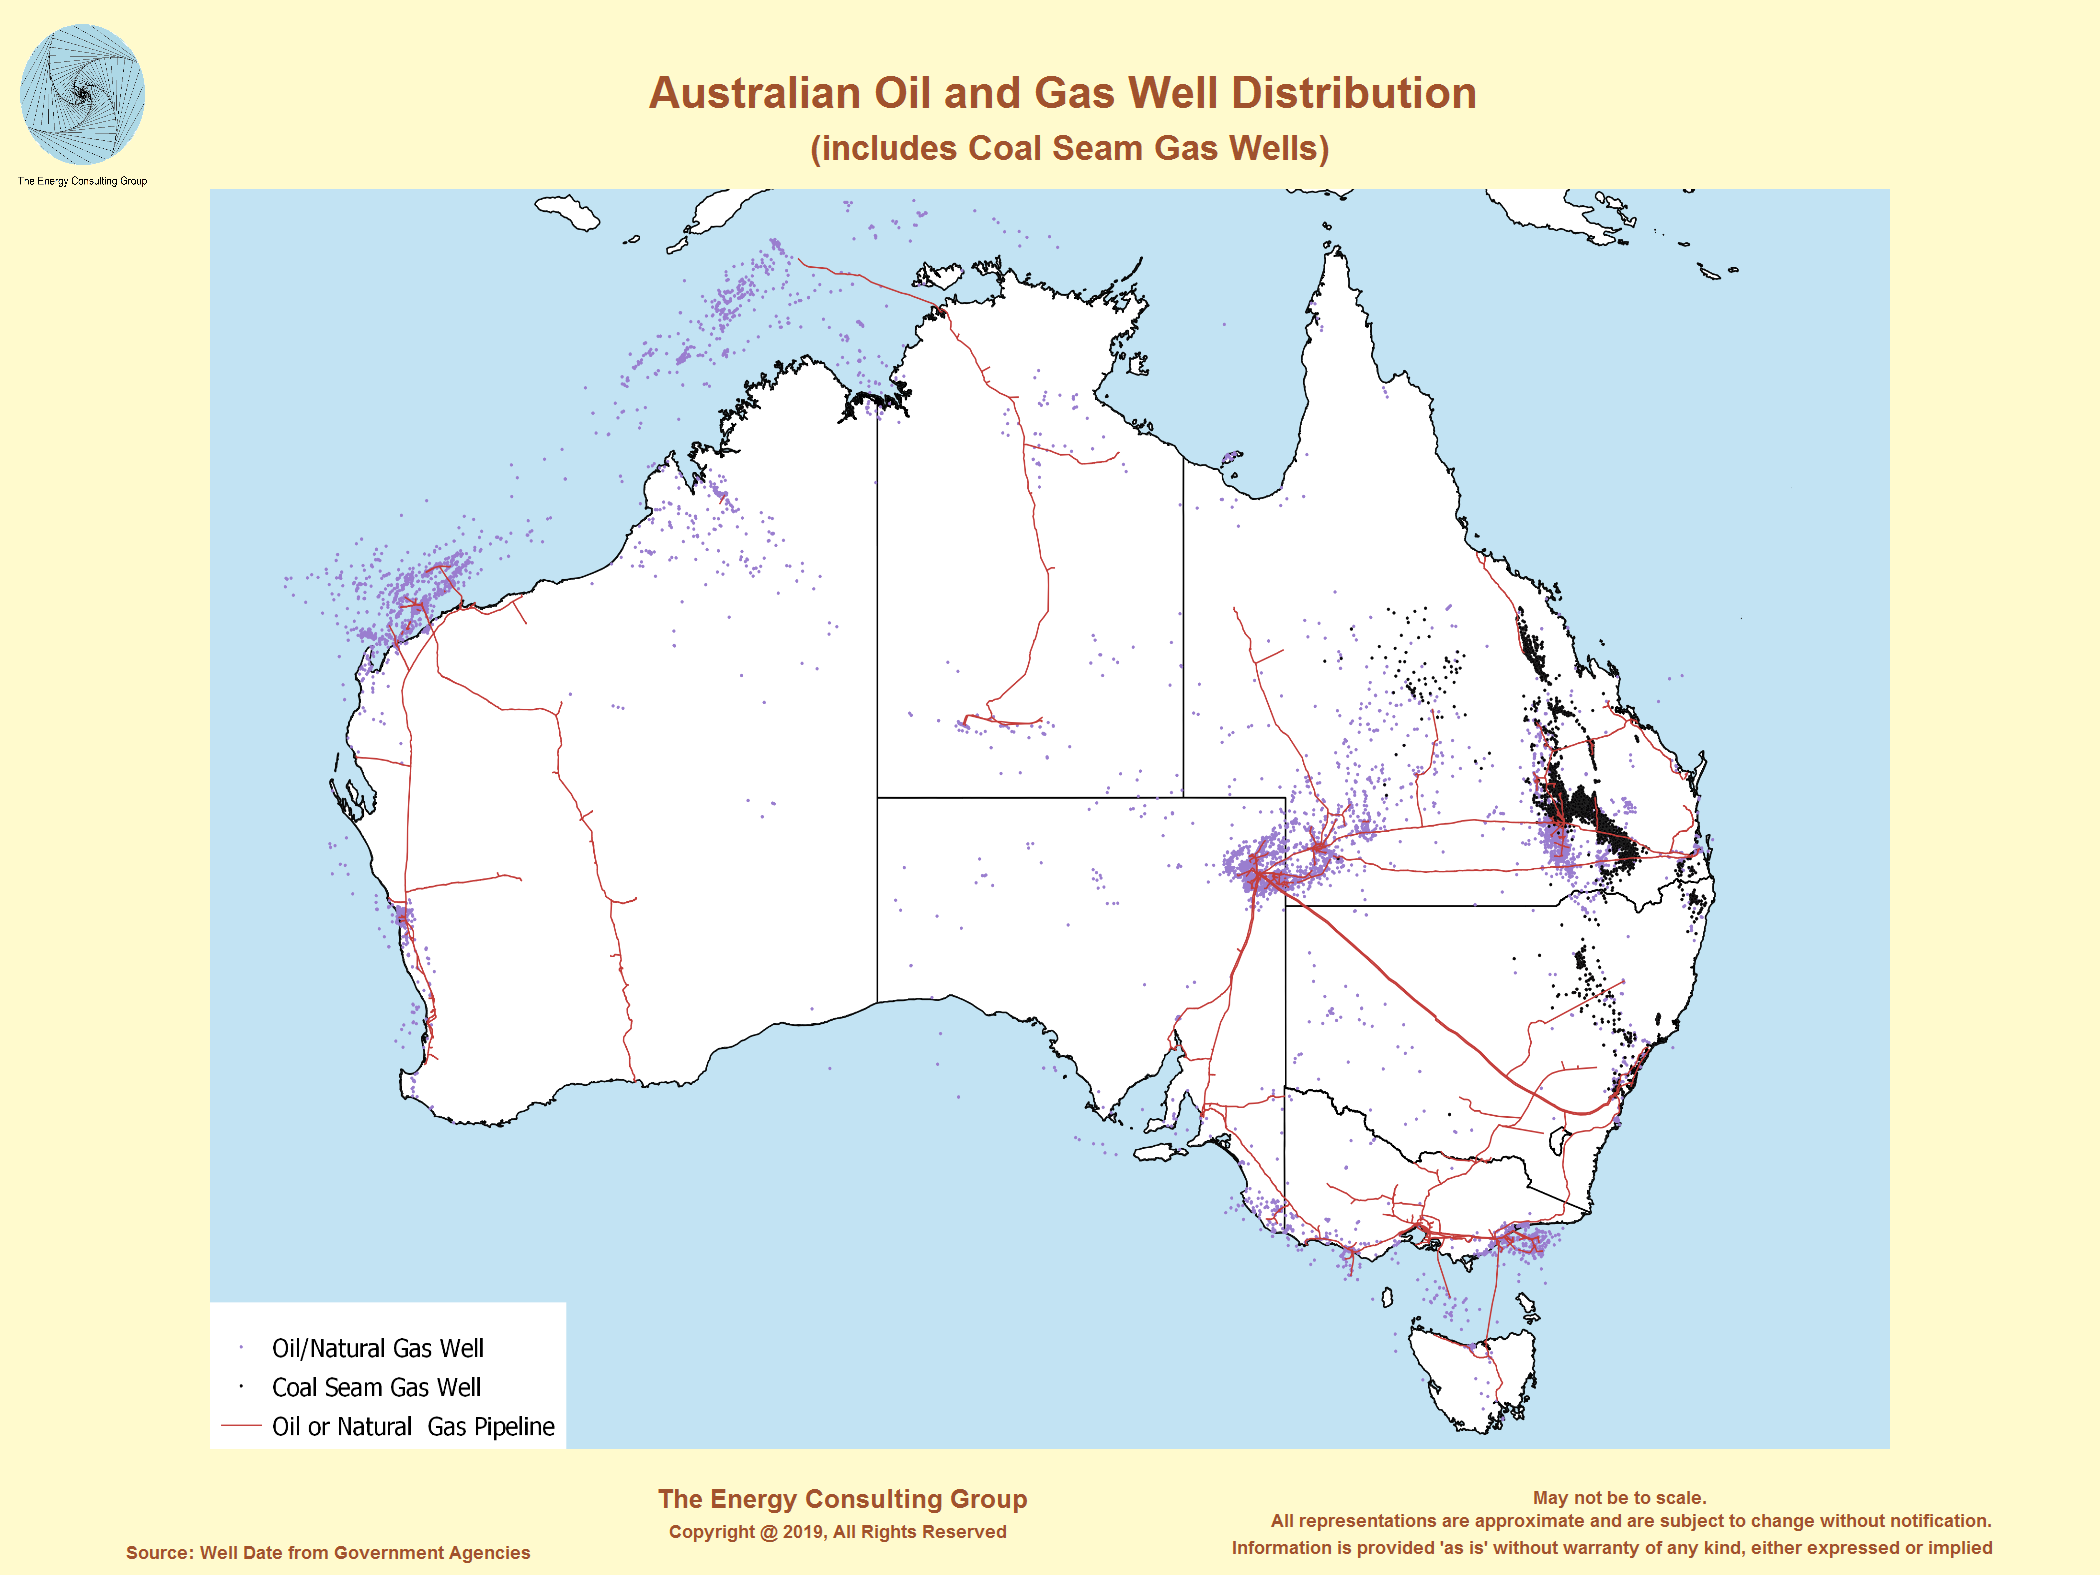 |
The following panel contains an interactive 3D elevation map of Australia. It is intended to help provide geographic context for the important oil and gas producing regions in Australia. To use the map, rotate it using the left mouse button, zoom using the mouse wheel, and control the viewing perspective using the right mouse button.
Link to full screen version the rotatable, zoomable 3D oil and gas map of Australia.
If you like this 3D map of Australia you might also appreciate these 3D maps as well (note: they work great on smart phones and tablets)
A 3D oil and gas map overview of the Gulf of Mexico (beautiful colors)
A 3D map view of oil and gas exploration prospects in the Alaska National
Wildlife Refuge (ANWR)
Cooper Basin
(the following Cooper Basin maps are courtesy of the Government of South Australian )
Cooper Basin Oil and Gas Fields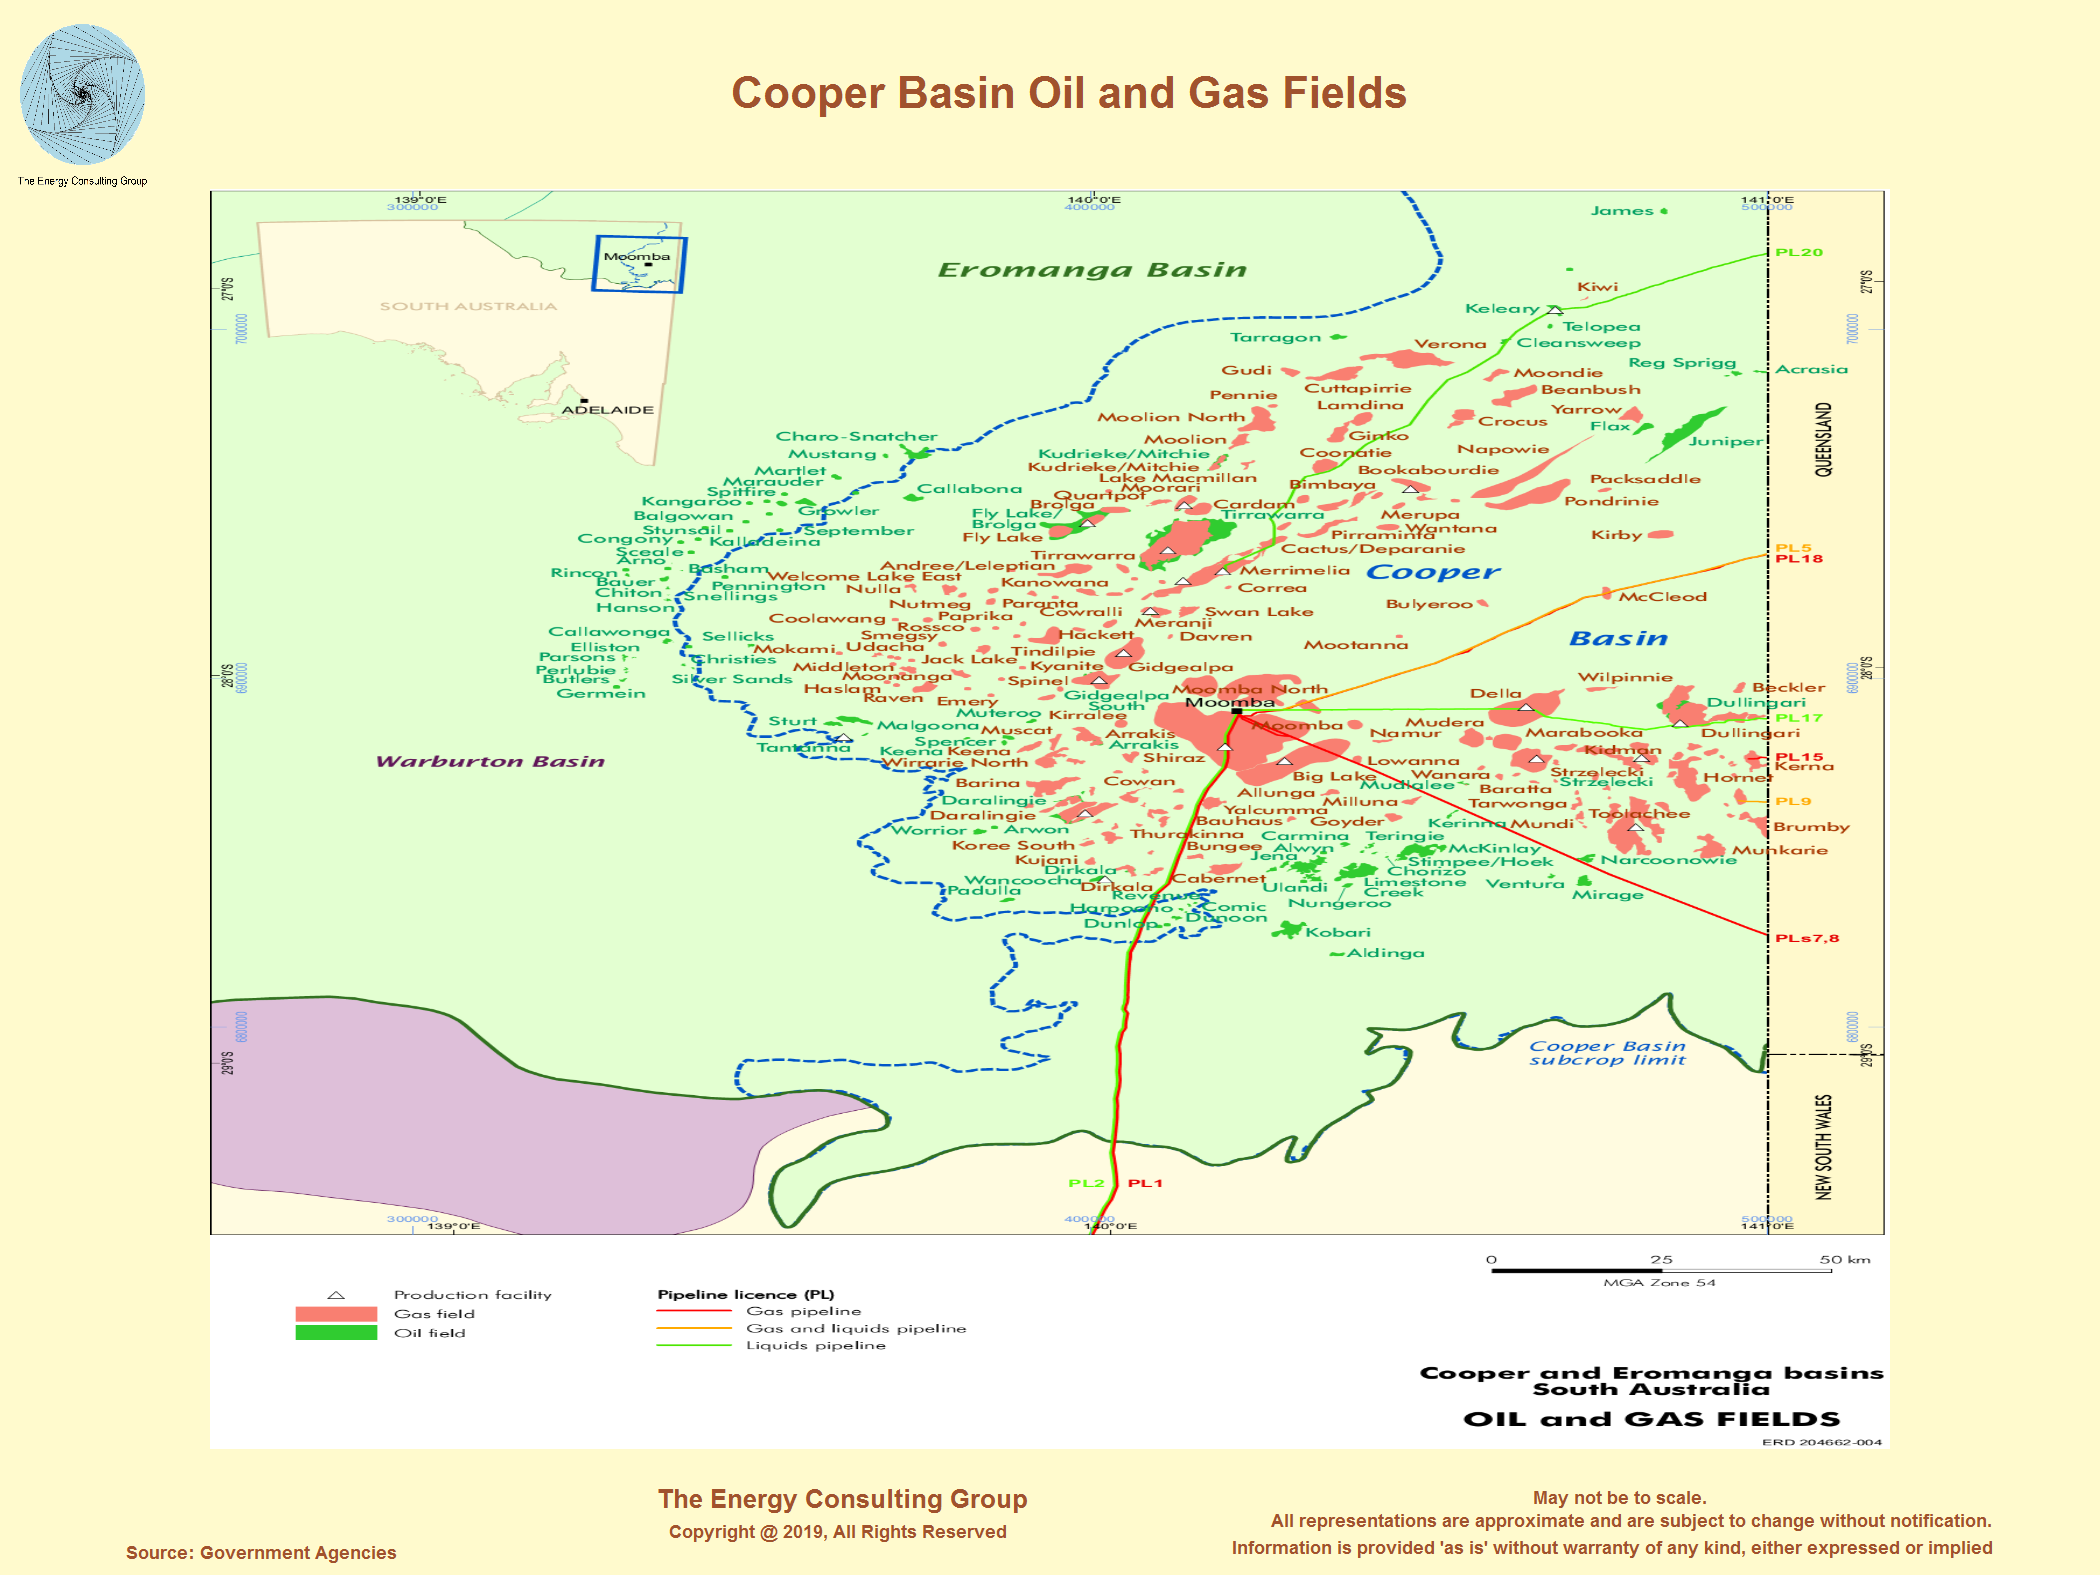 |
Cooper Basin Oil and Gas Tenements and Licenses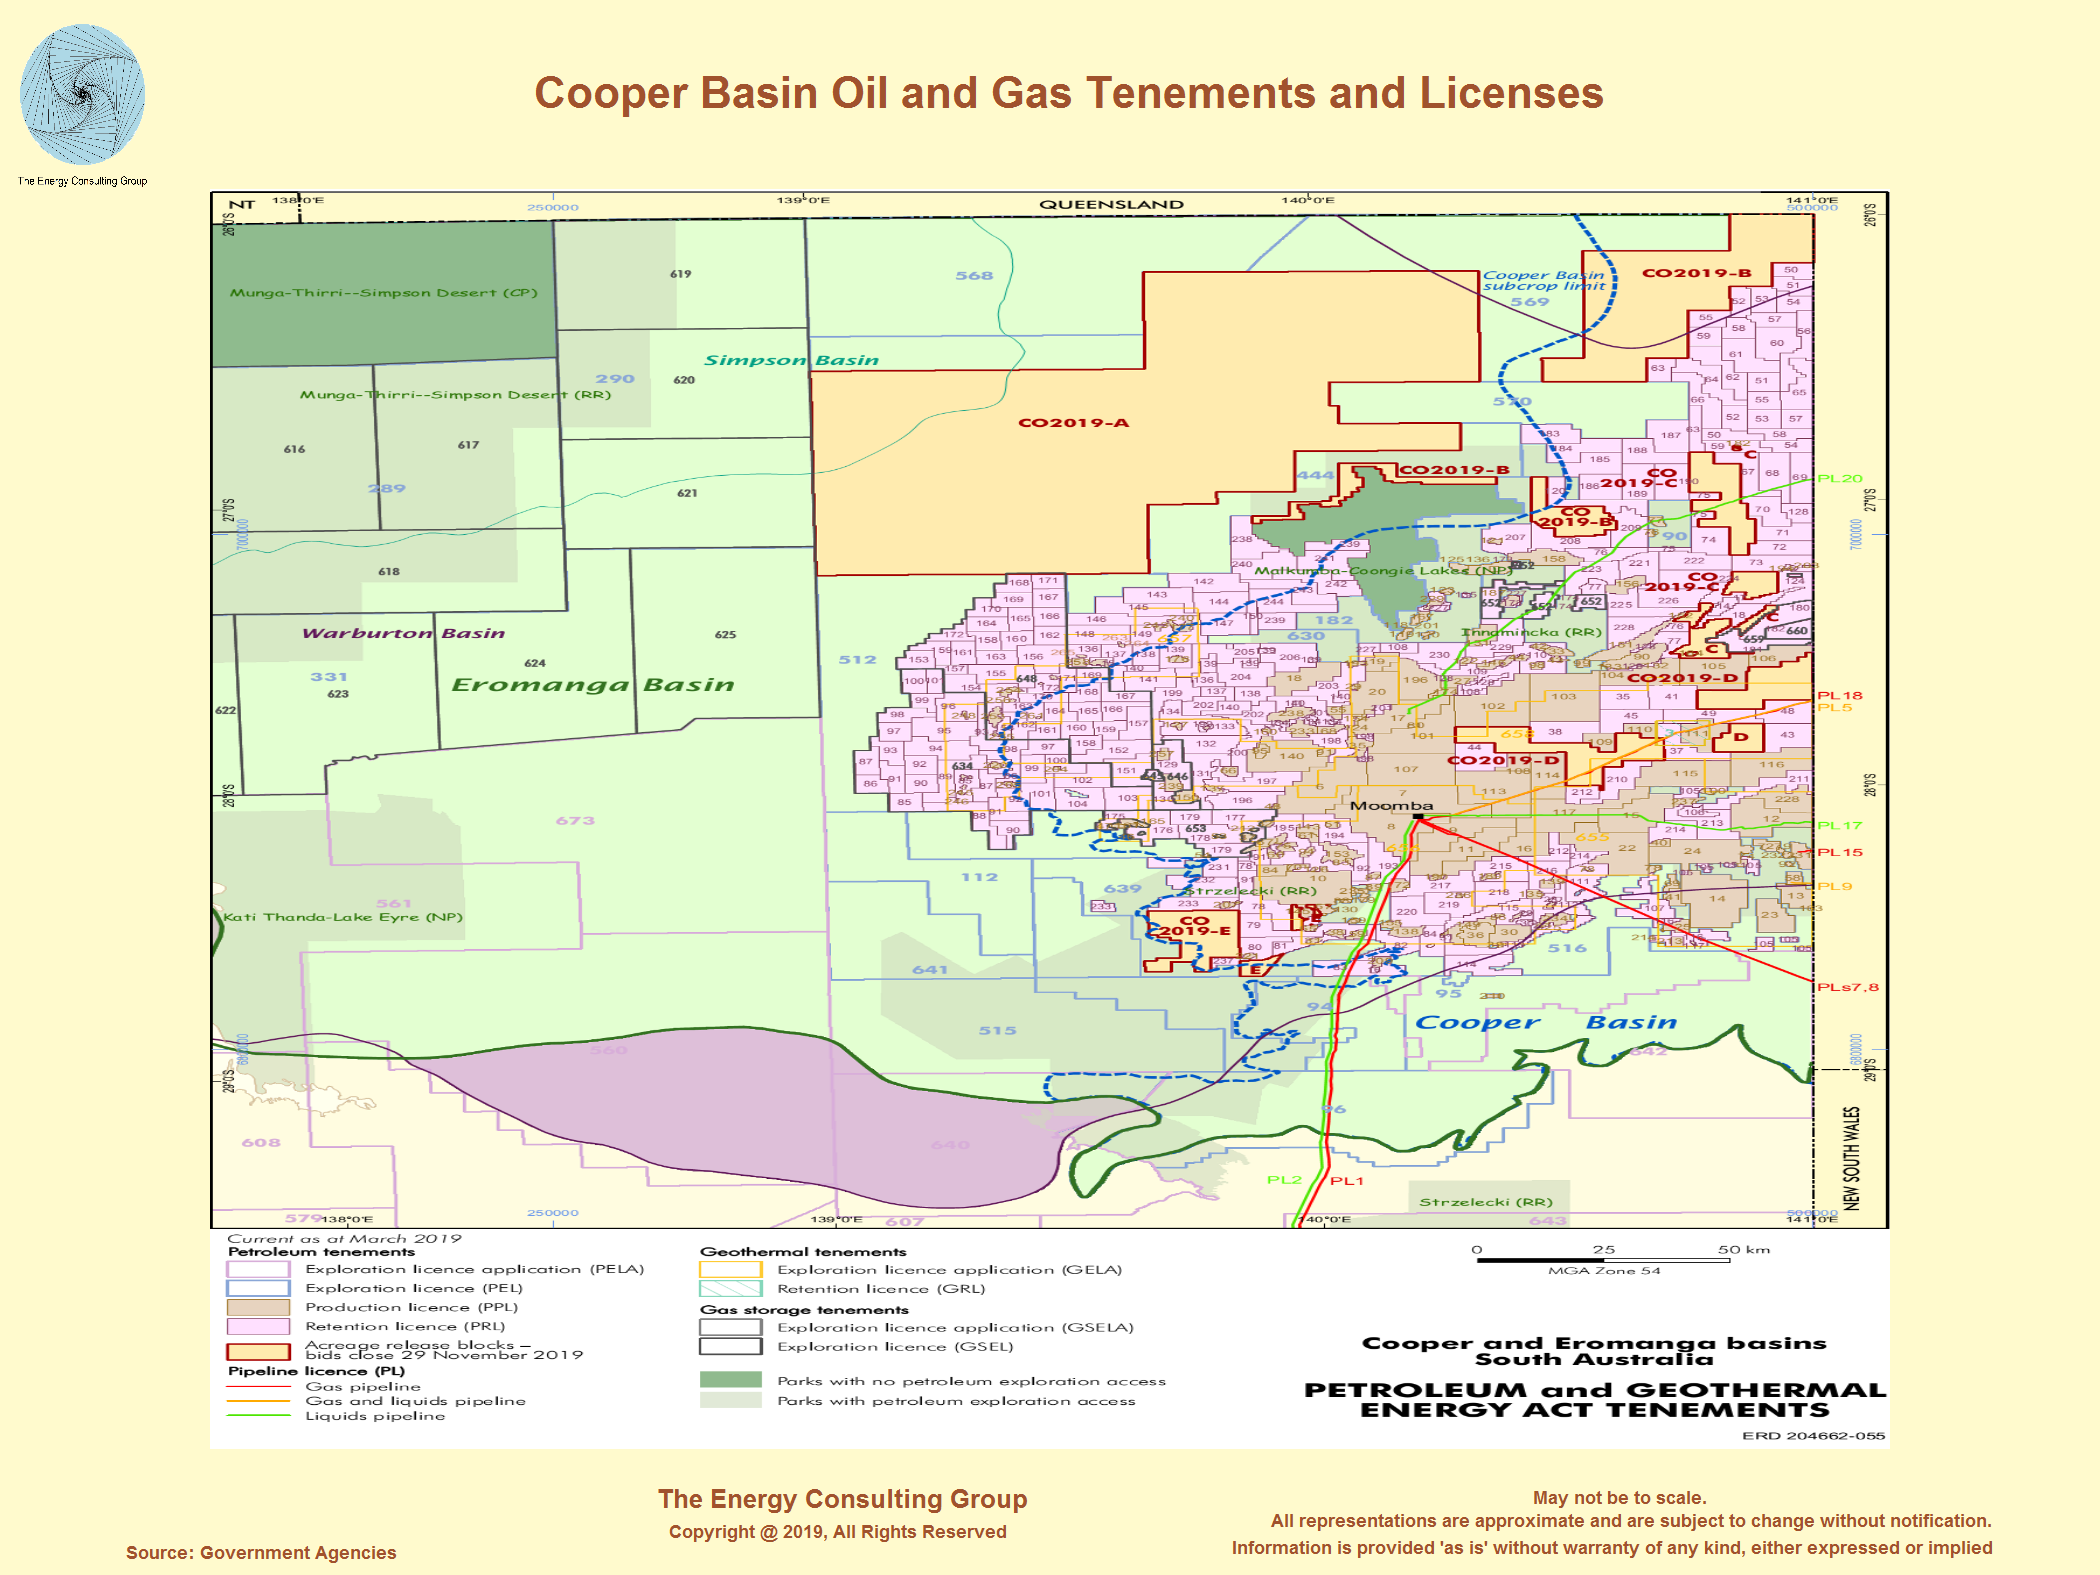 |
| Cooper Basin Oil and Gas Well Distribution |
Western Australia
Western Australia: Northwest Shelf Oil
and Gas Overview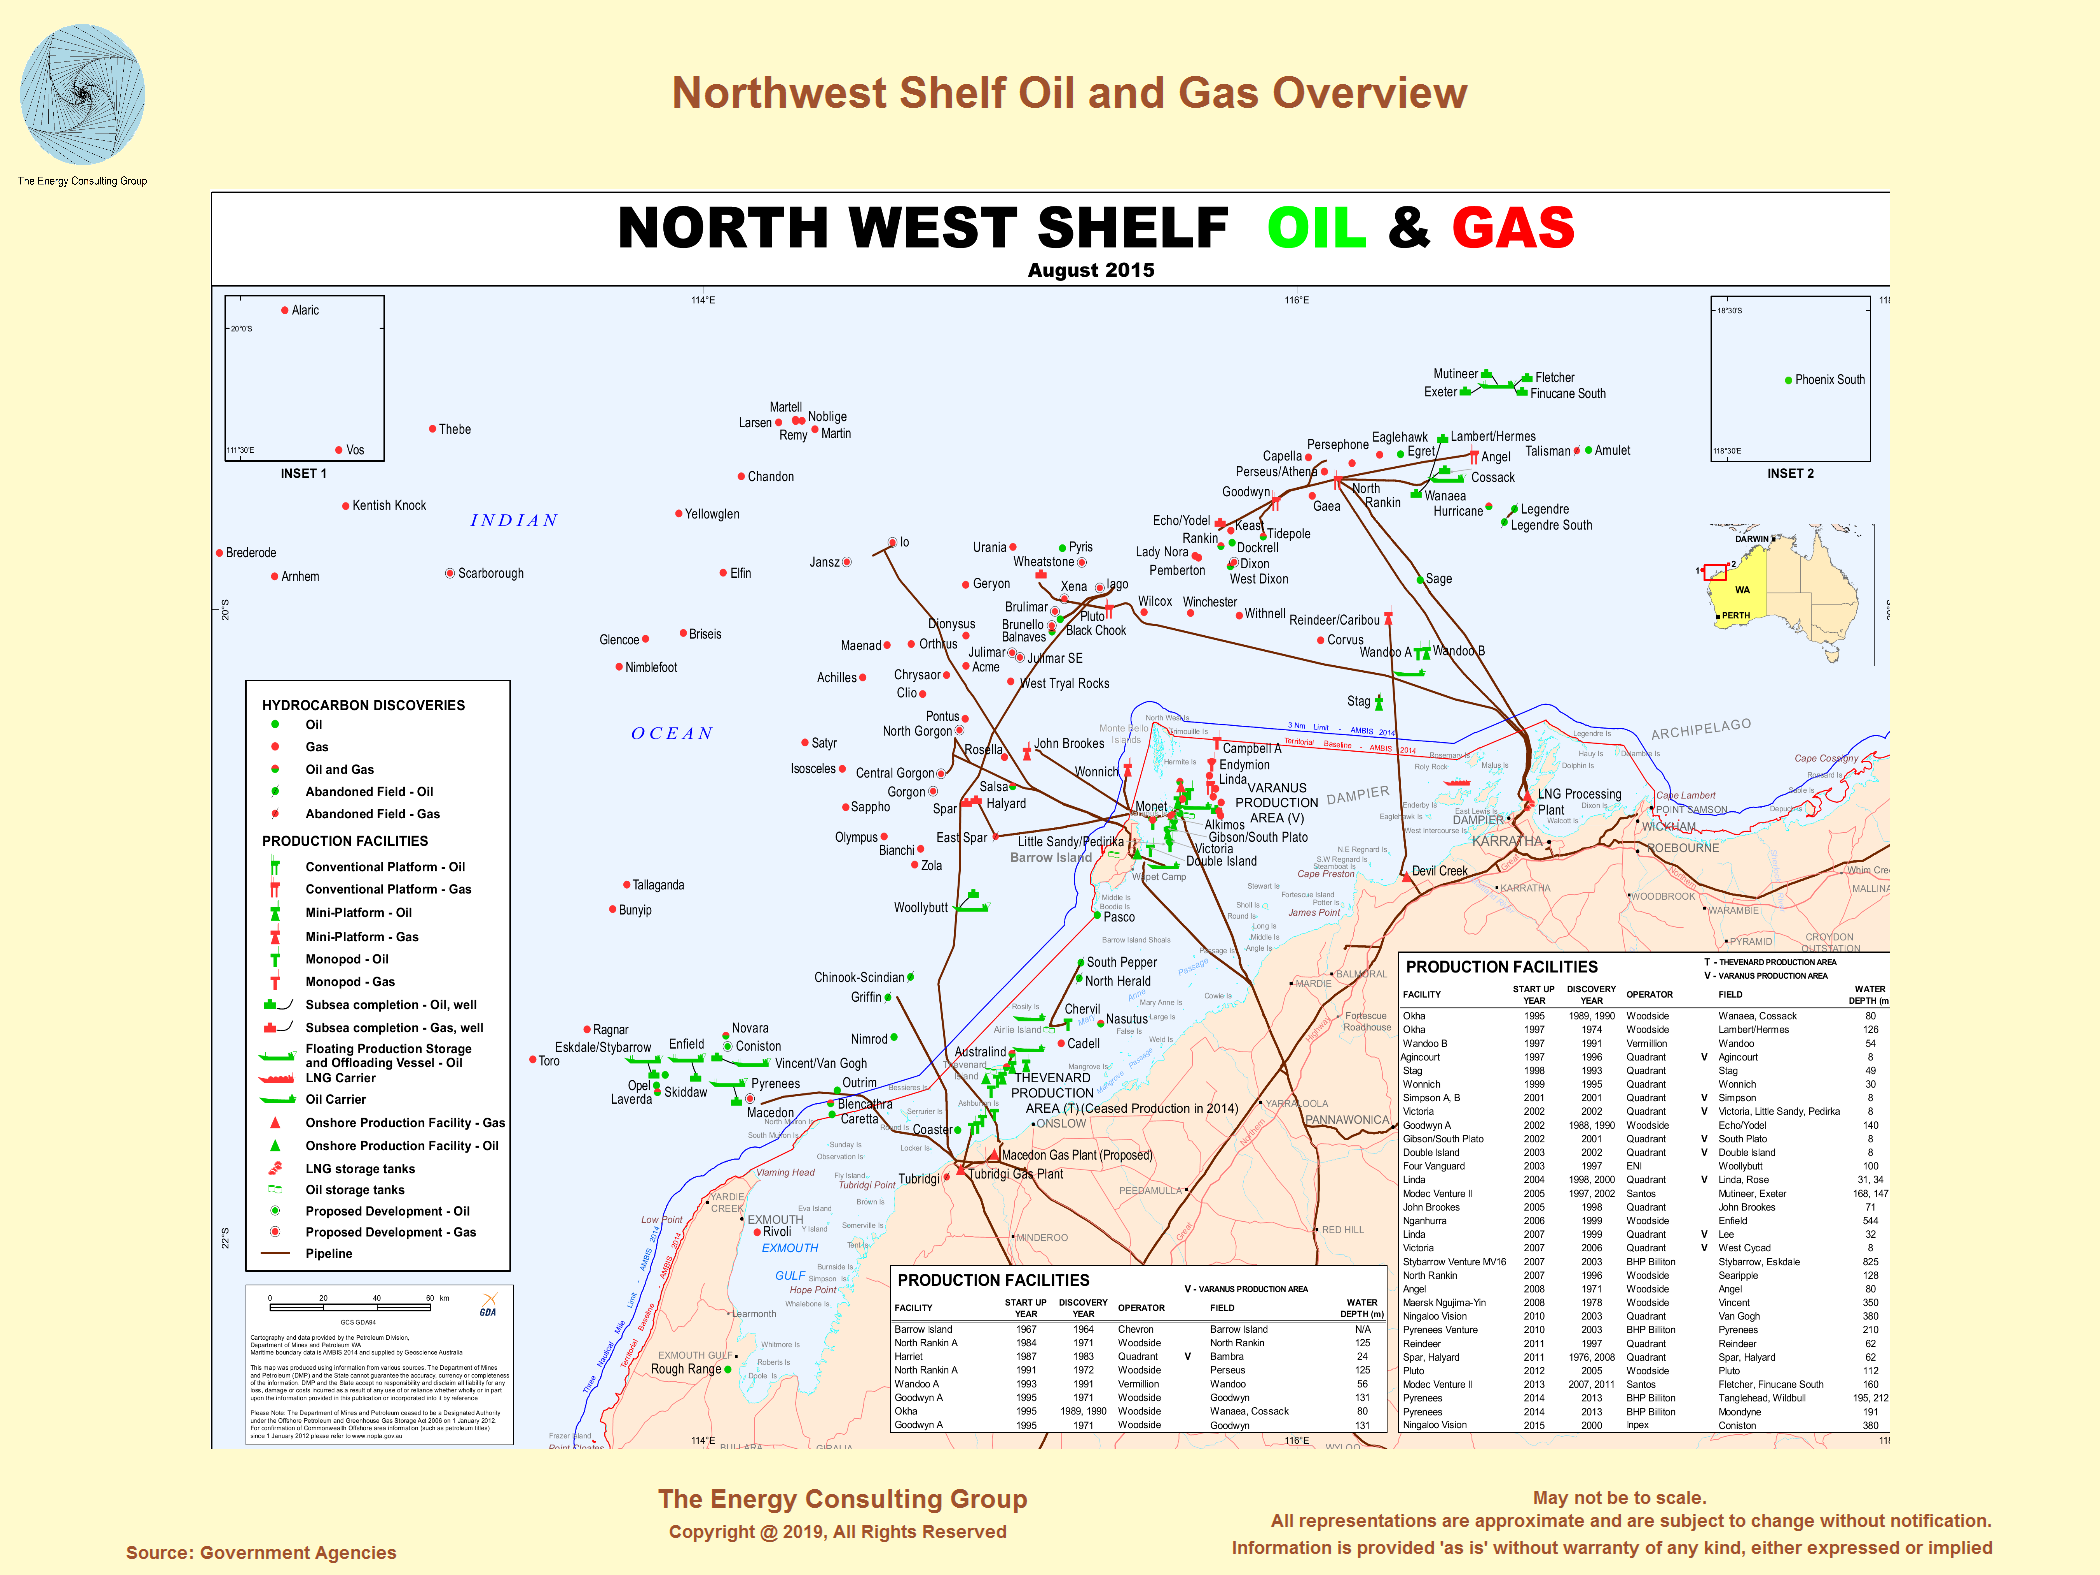 |
Western Australia: Timor Sea Oil and Gas
Overview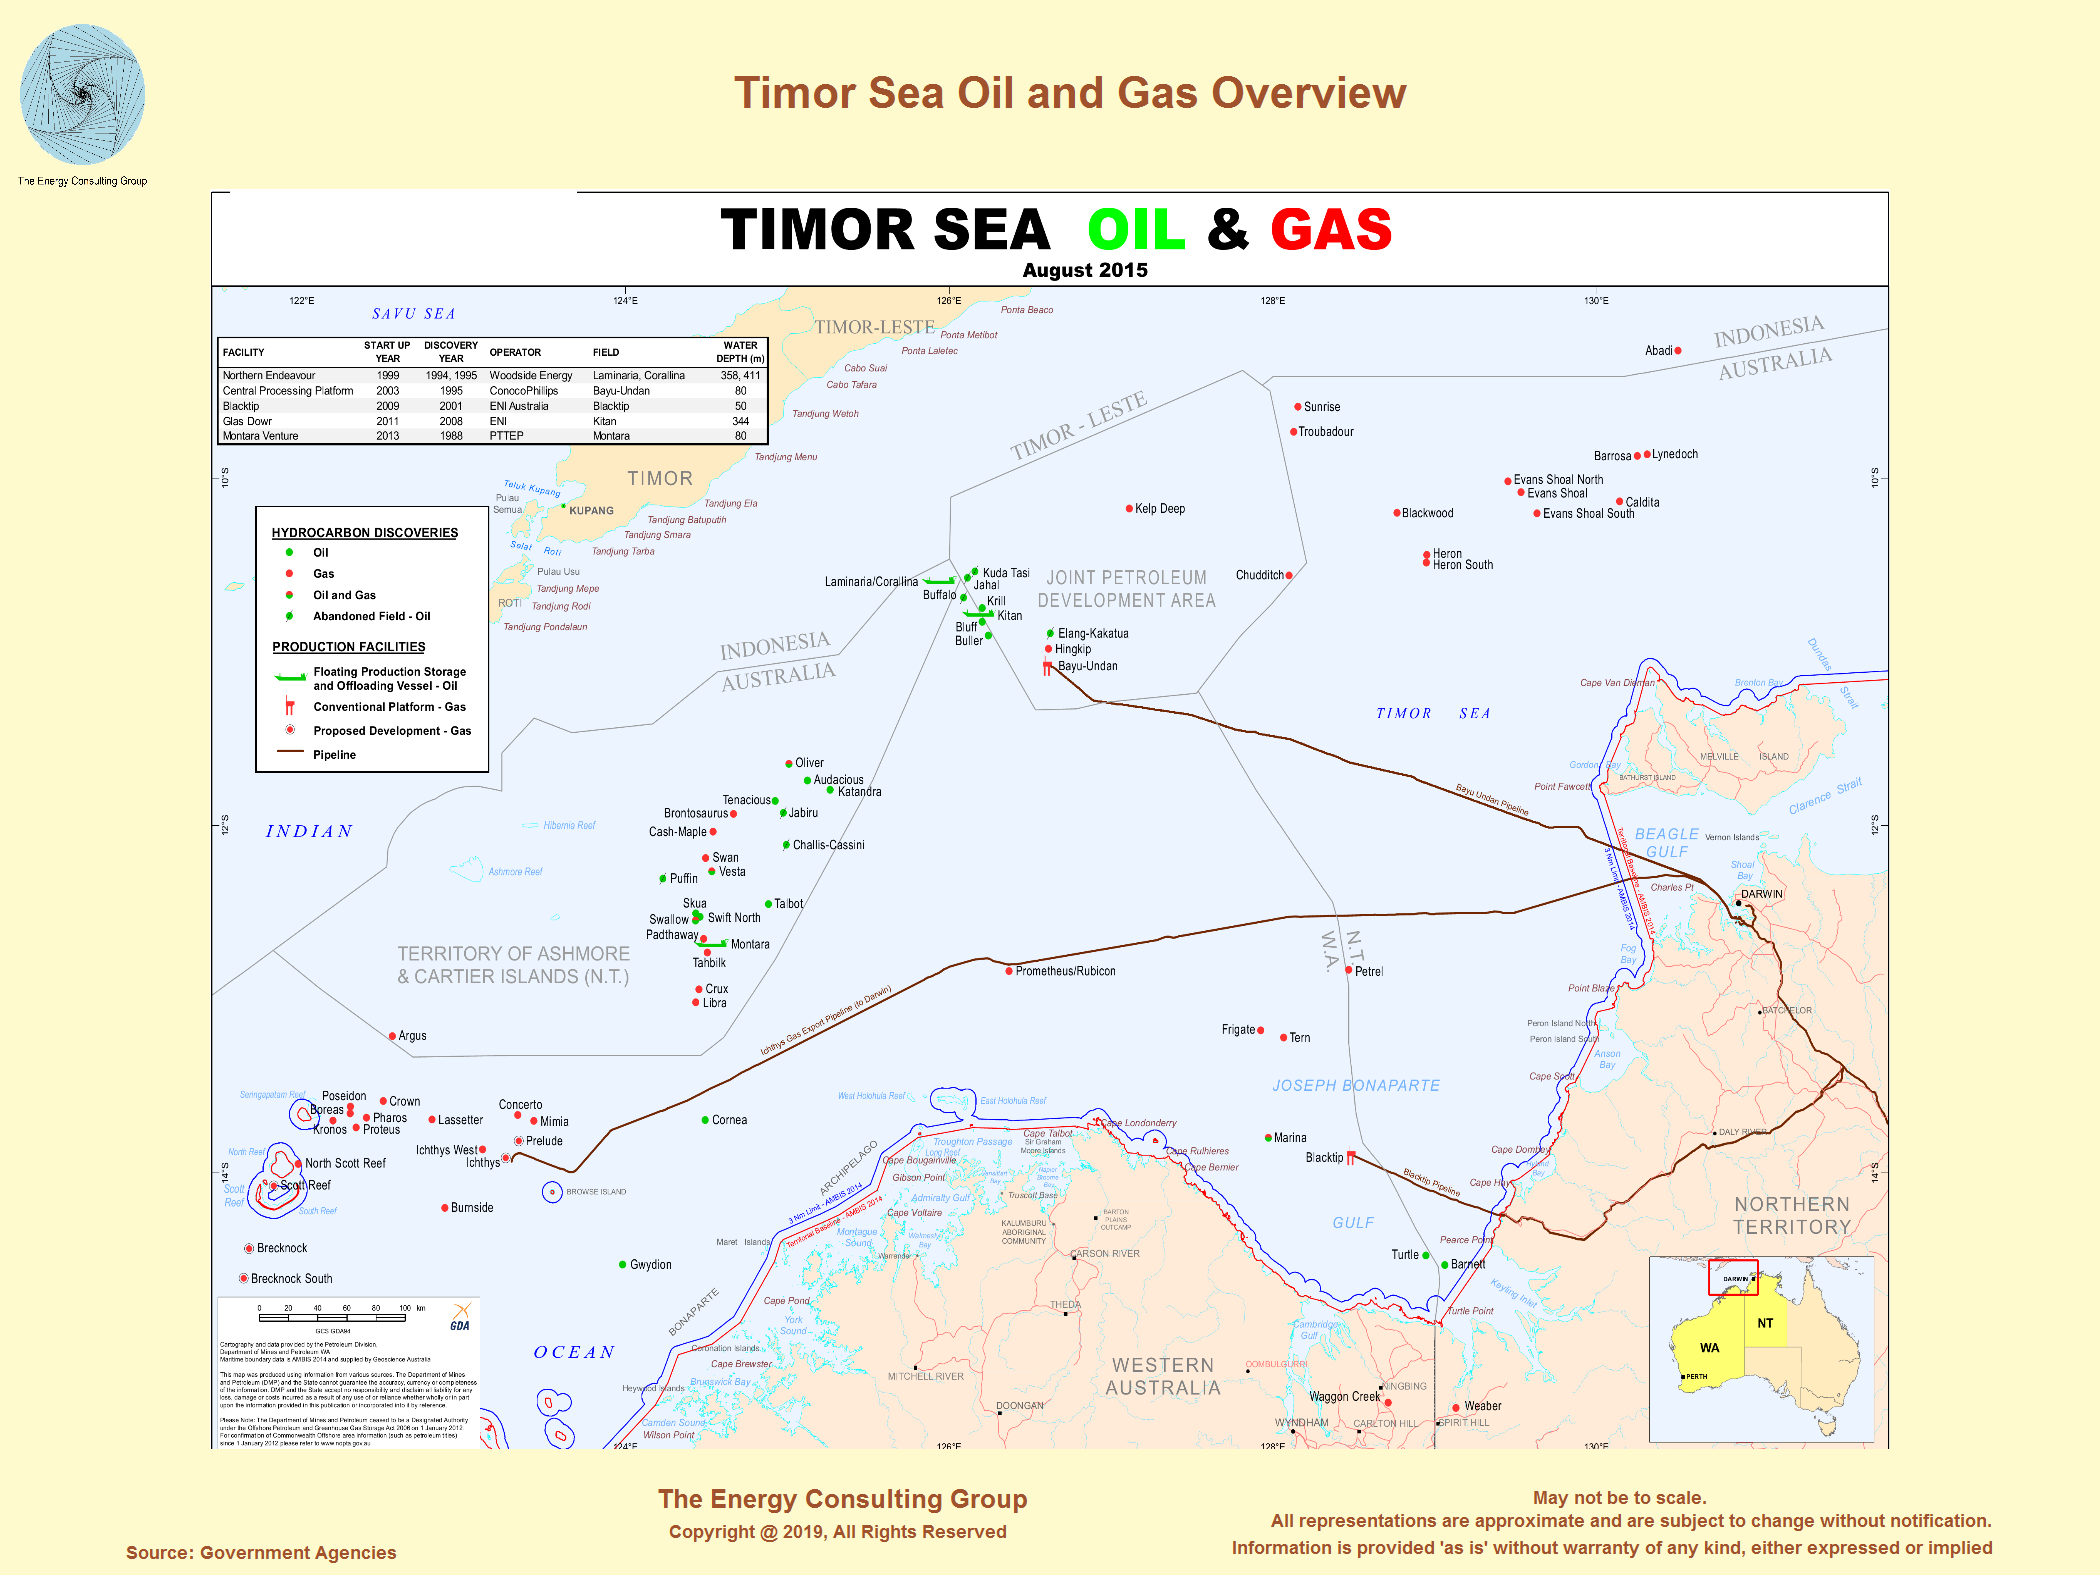 |
Western Australia: Oil and Gas Pipeline
Infrastructure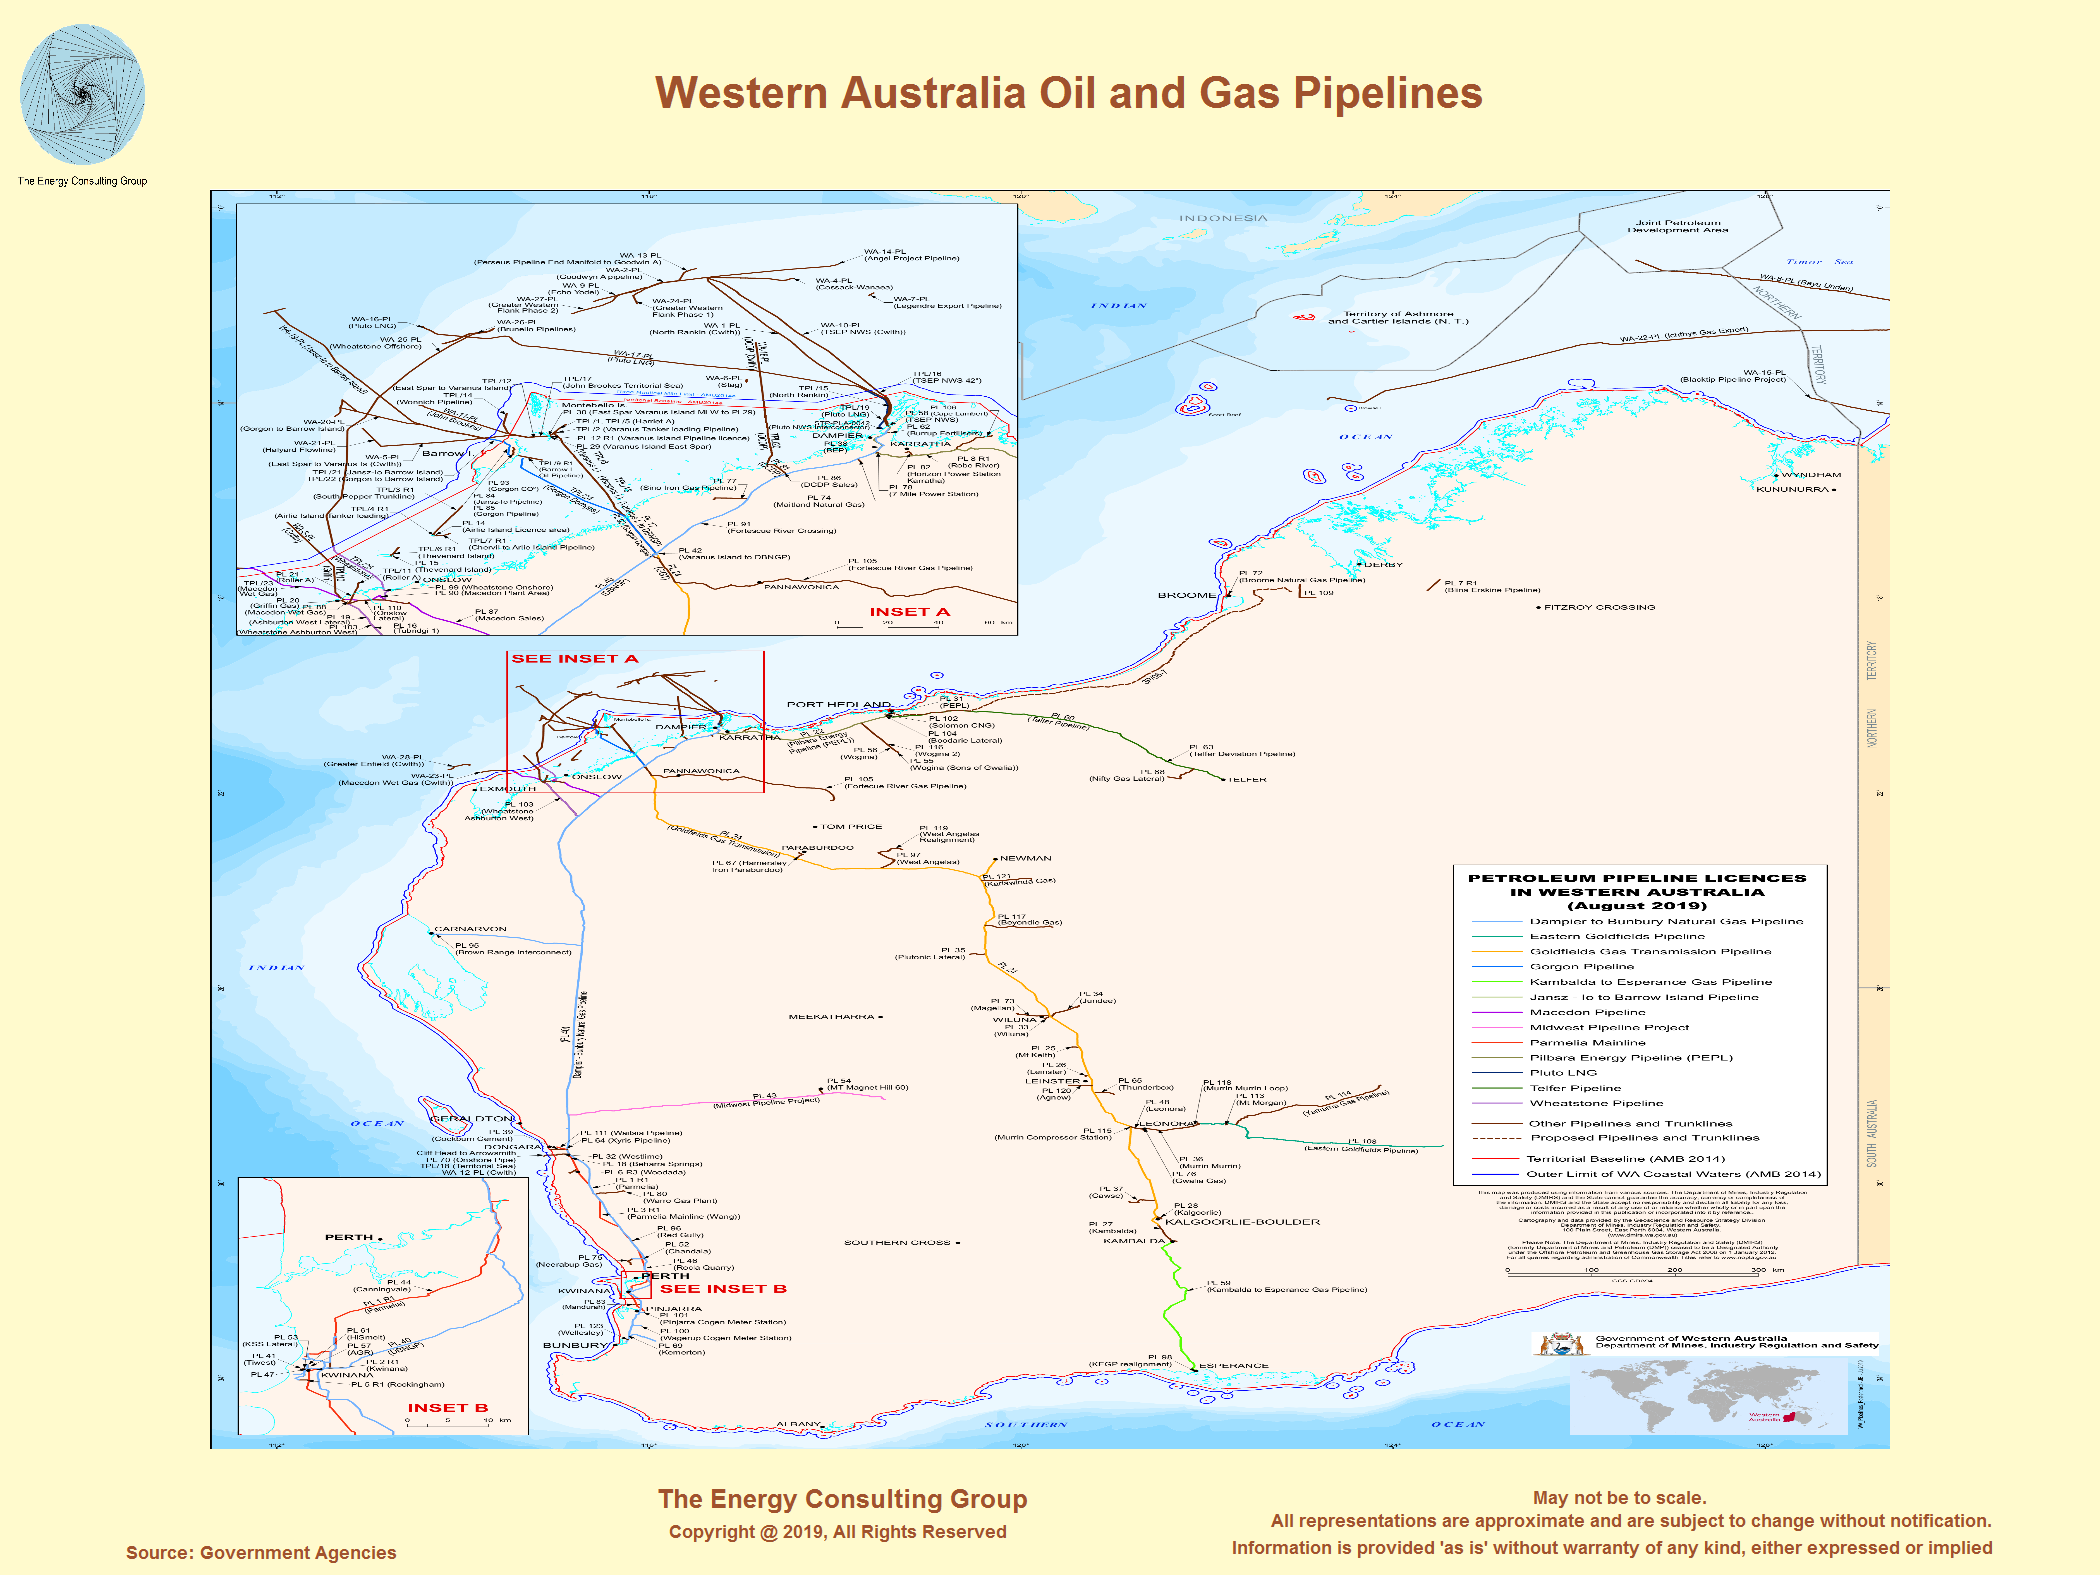 |
Bass Strait (Gippsland Basin), and Otway Basin
Bass Strait (Gippsland Basin): Victoria,
Australia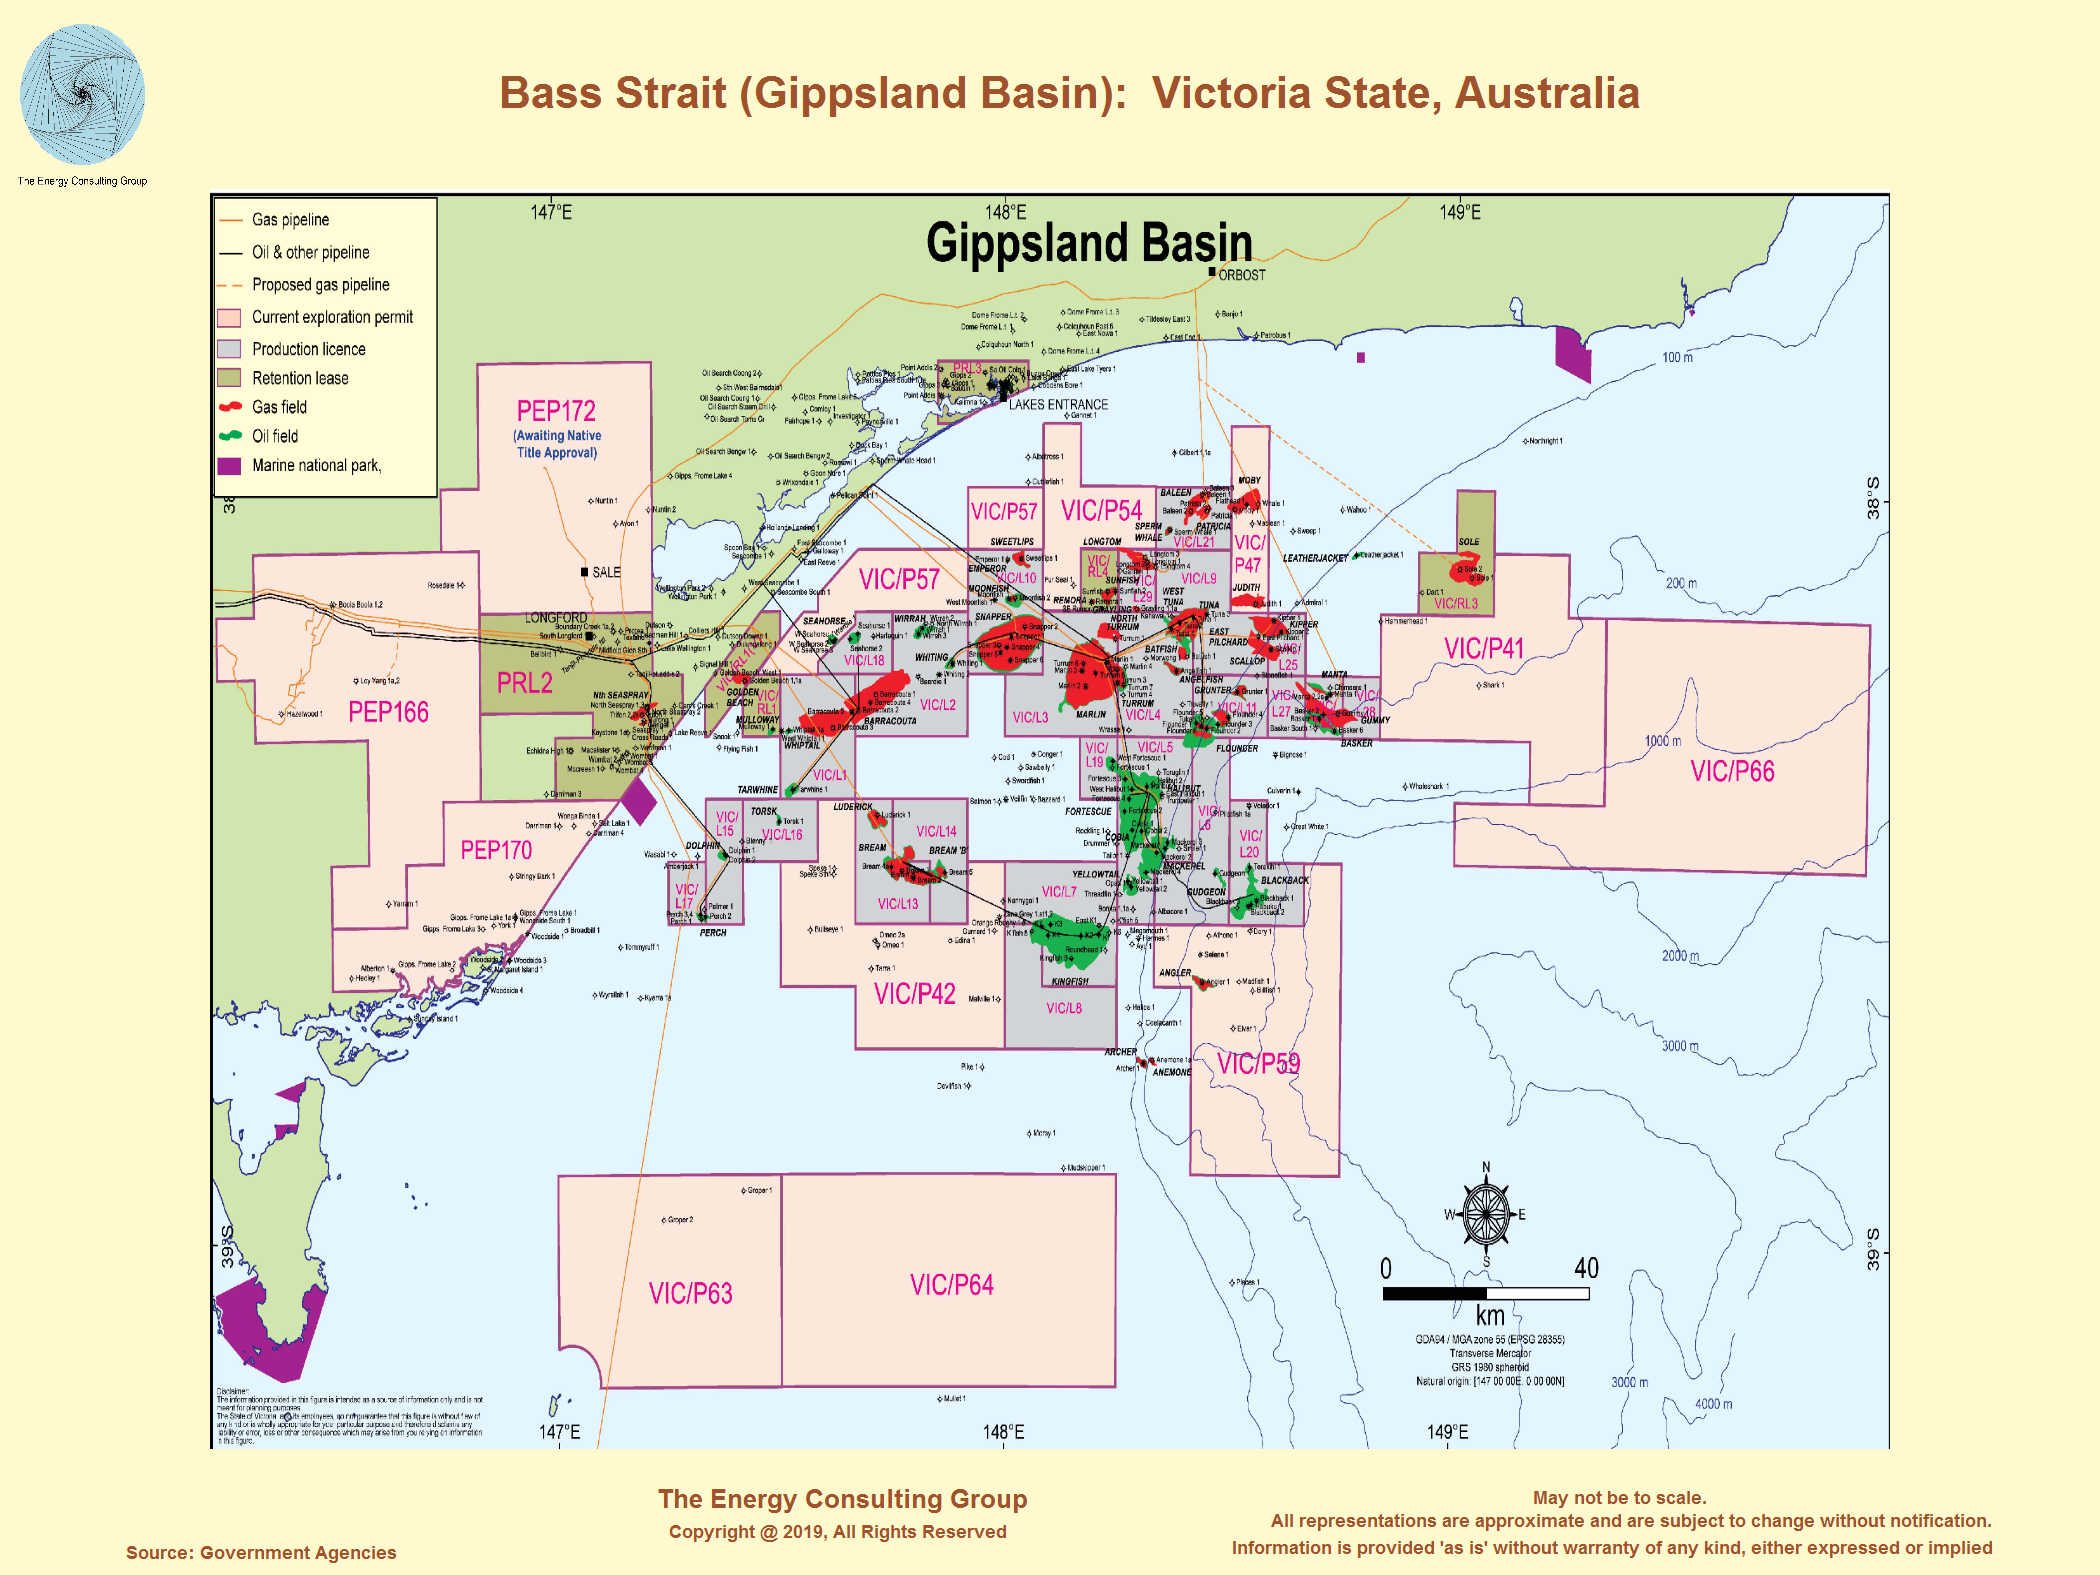 |
Otway Basin: Victoria, Australia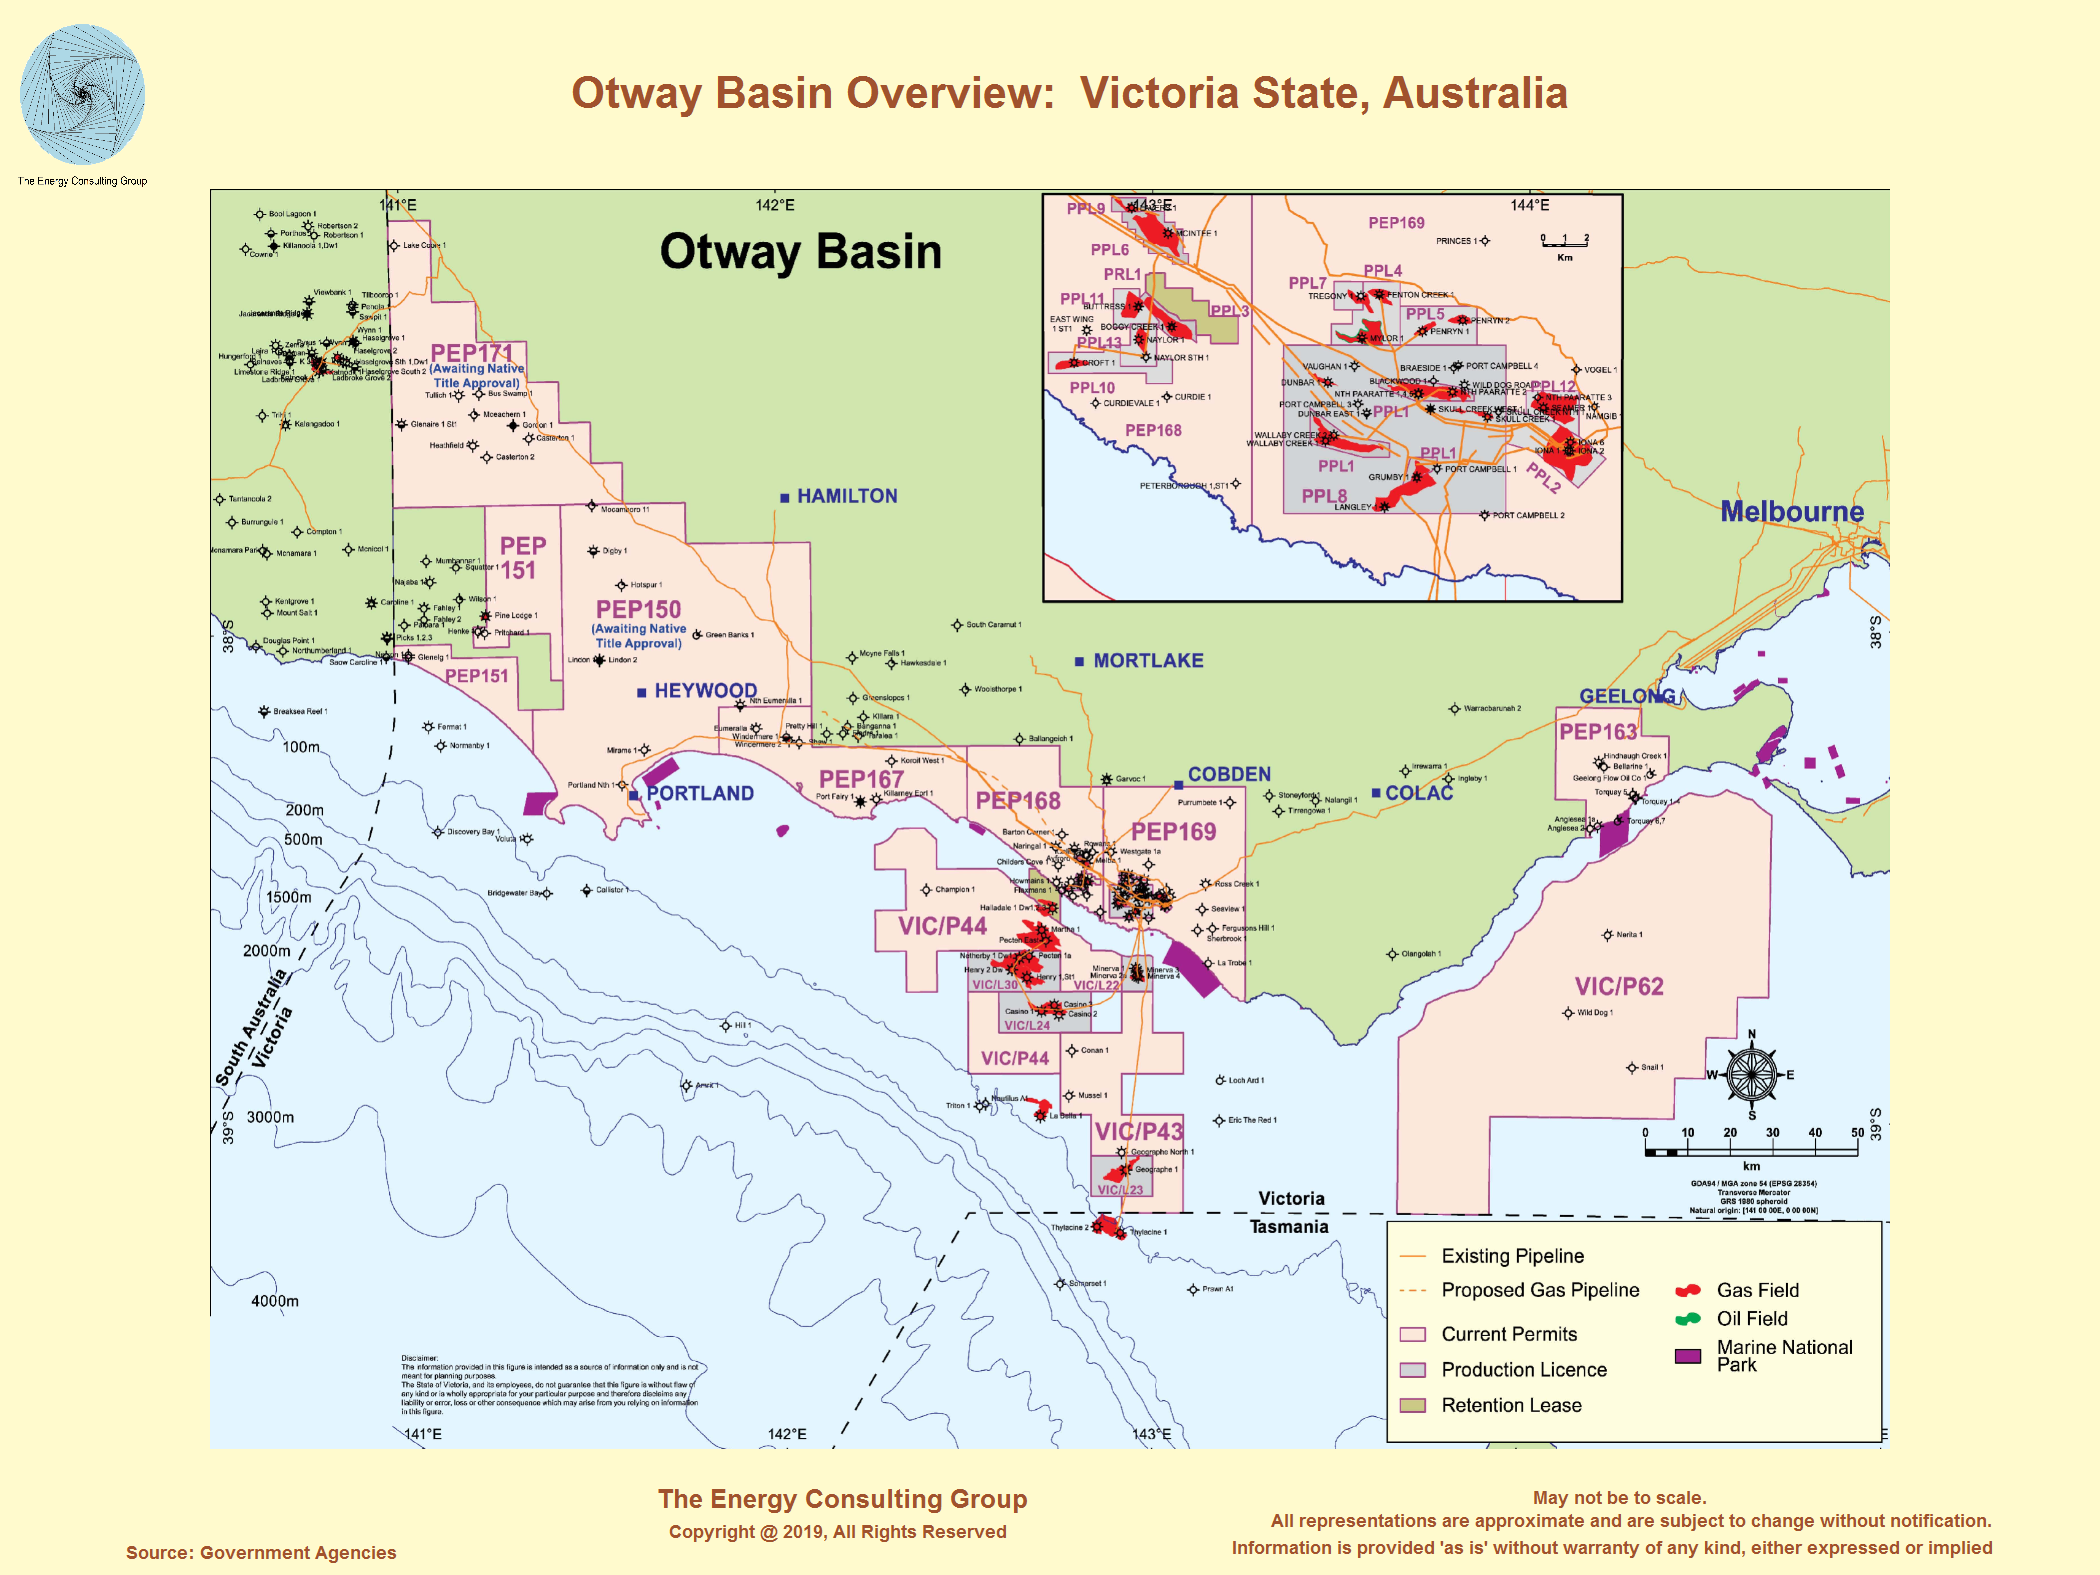 |
Otway Basin-Natural Gas Focus: Victoria,
Australia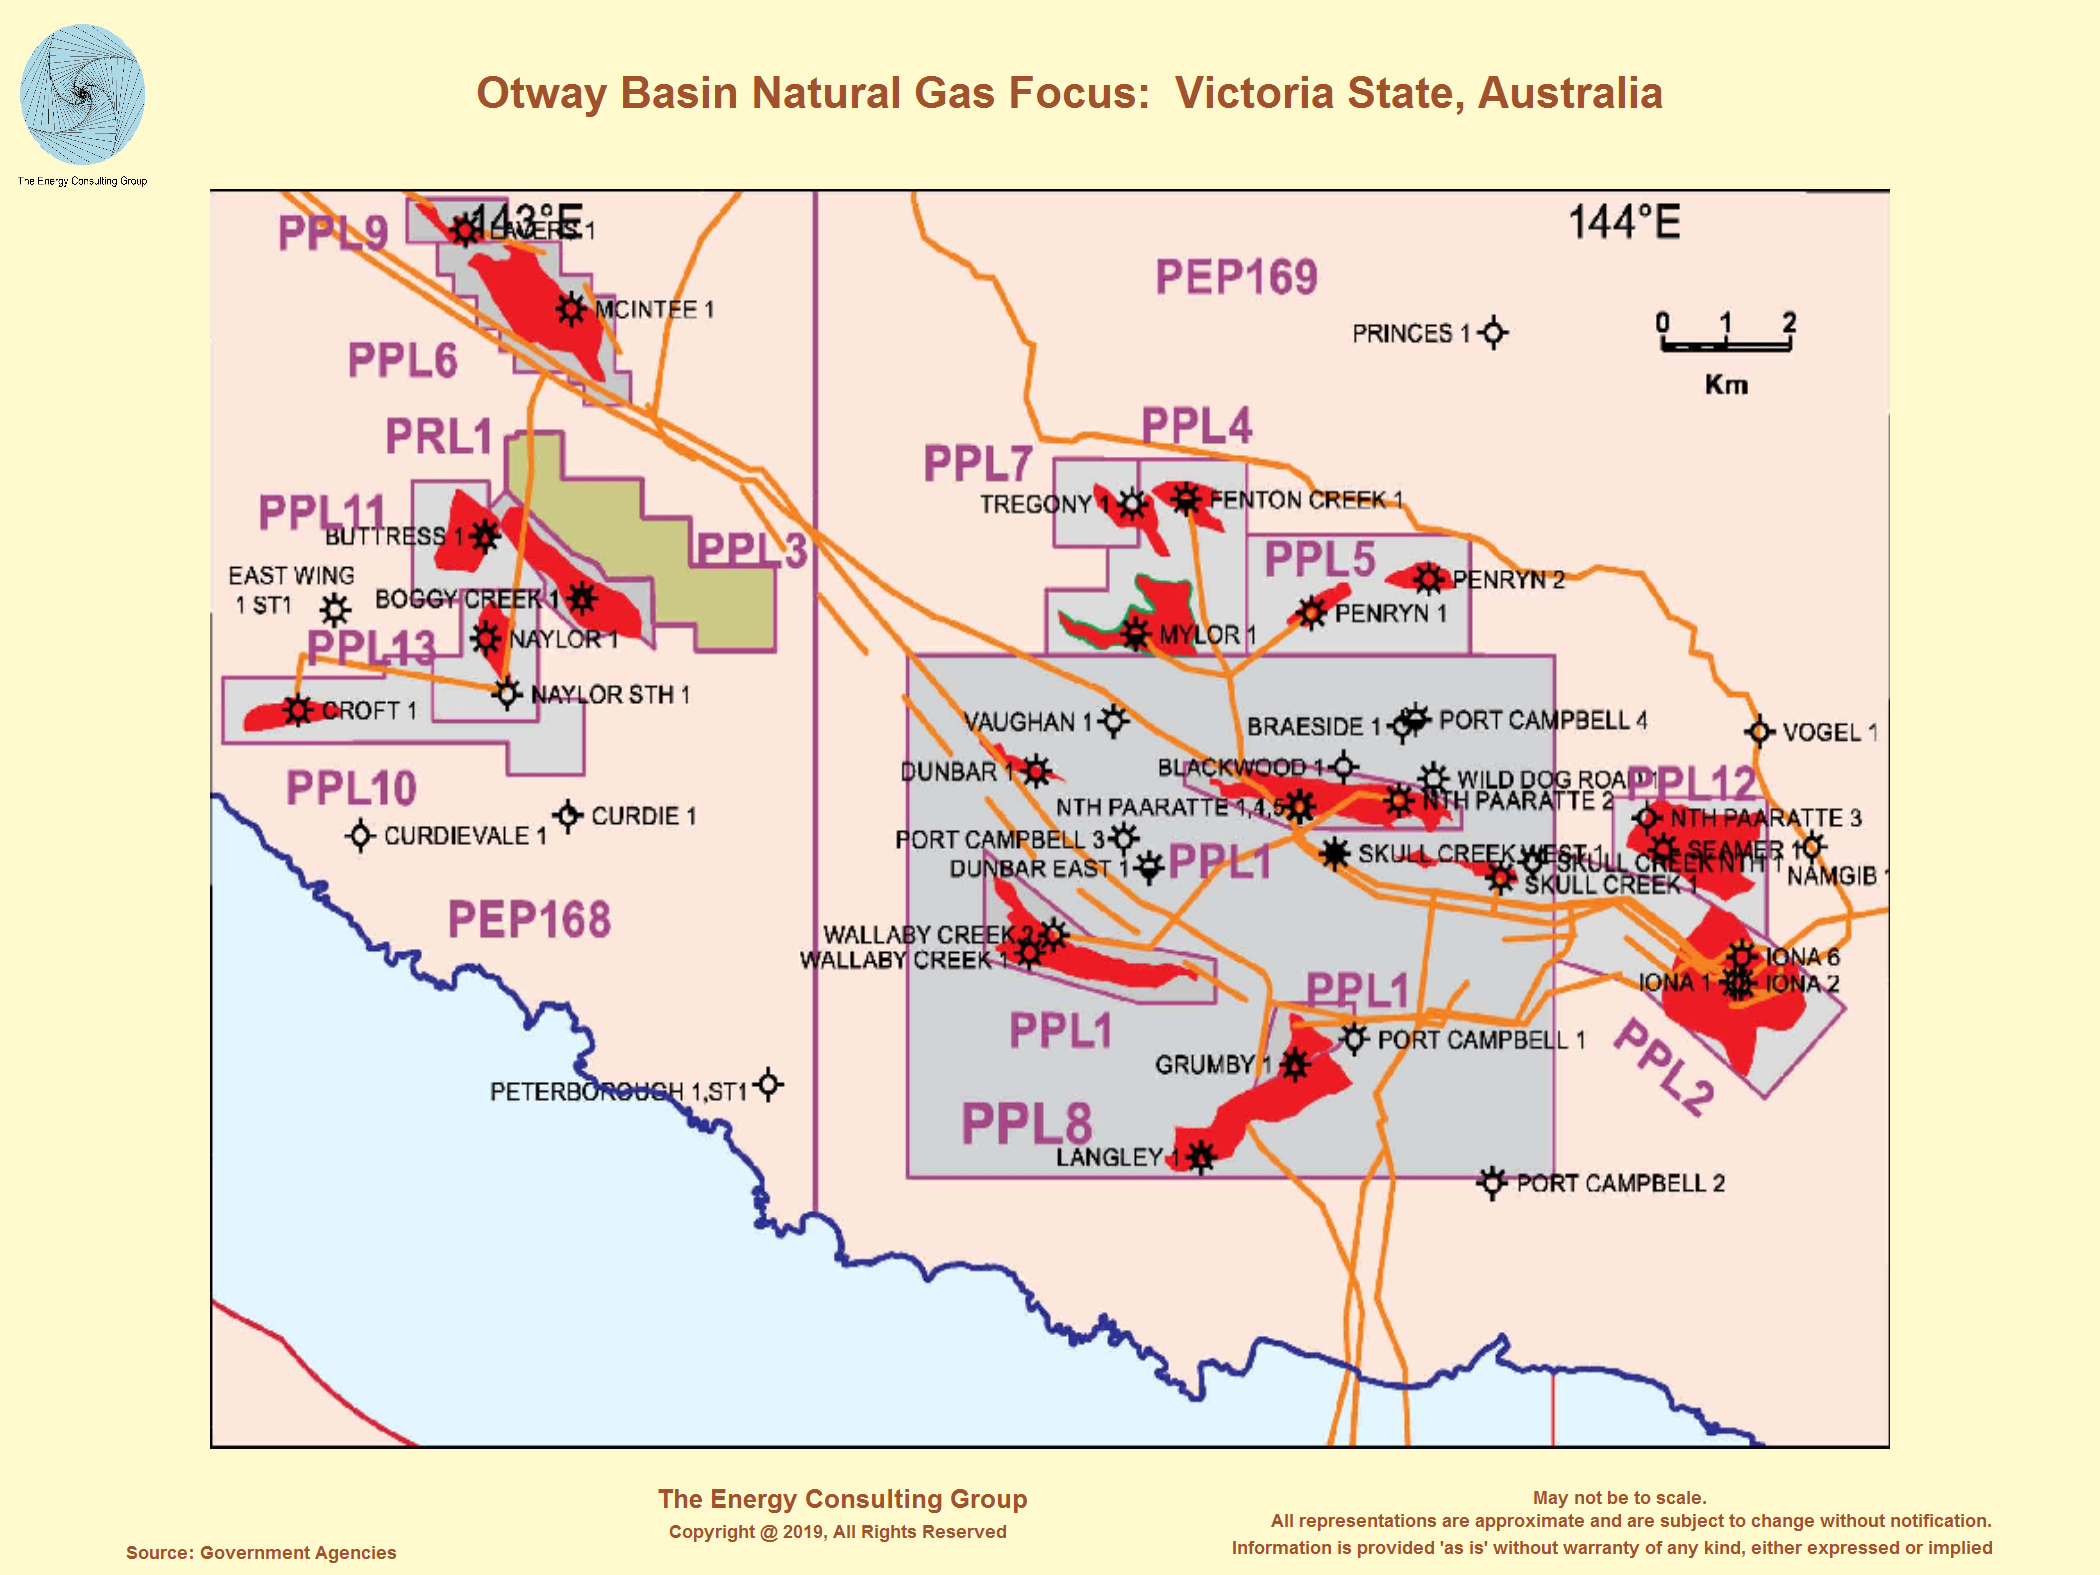 |
The Energy Consulting Group home page
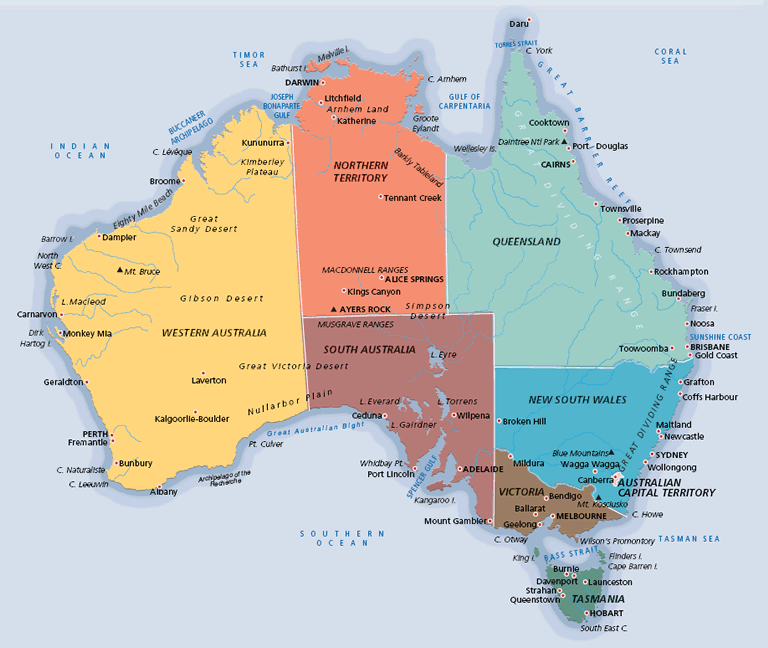
Australia: Country Overview
(source: EIA)
Australia, rich in hydrocarbons and uranium, was the world's second-largest coal exporter in 2012 and the third-largest liquefied natural gas (LNG) exporter in 2013.
Australia is rich in commodities, including fossil fuel and uranium reserves. It is one of the few countries belonging to the Organization for Economic Cooperation and Development (OECD) that is a significant net energy exporter, sending nearly 70% of its total energy production (excluding energy imports) overseas, according to data from Australia's Bureau of Resource and Energy Economics (BREE).
Except for crude oil and other liquids, Australia retains a surplus of all other energy commodities. Australia was the world's second-largest coal exporter based on weight in 2012 and the third-largest exporter of liquefied natural gas (LNG) in 2013. Energy exports accounted for 24% of Australia's total export revenues in 2012, according to BREE. The country holds the world's largest recoverable reserves of uranium (about 32%, based on 2012 data) and is the third-largest producer and exporter of uranium for nuclear-powered electricity, according to the World Nuclear Association. Australia is a net importer of crude oil and refined petroleum products, although the country exports some petroleum liquids.
Australia's stable political environment, relatively transparent regulatory structure, substantial hydrocarbon reserves, and proximity to Asian markets make it an attractive place for foreign investment. The previous Australian government published an Energy White Paper in 2012 that outlines an energy policy that attempts to balance securing domestic energy at affordable prices with increasing exports to help supply Asia's growing demand for fuel.
Both of these paths involve developing more energy infrastructure, attracting greater investment, creating efficient energy markets and pricing mechanisms for consumers, and delivering cleaner and more sustainable energy. More recently, Australia's expanding energy industry has encountered escalating project costs and a shortage of labor. These factors, coupled with a bigger push for clean energy and stricter environmental regulations in some states, are challenges that domestic and international companies face in developing Australia's energy resources.
Source: University of Nebraska, Omaha
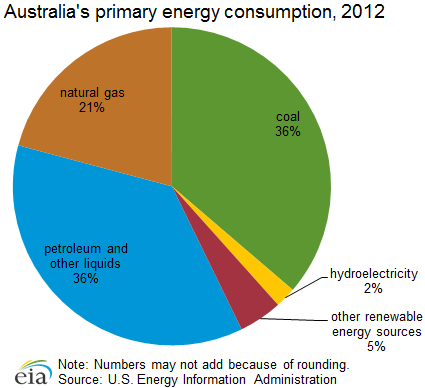
Primary energy consumption
Australia has experienced limited energy demand growth because of lower levels of energy intensity compared to a few decades ago. Energy efficiency measures in many end-use sectors, technological advances, and a shift from heavy industries to a more service-sector oriented economy have resulted in a decrease in Australia's energy intensity.
Australia is heavily dependent on fossil fuels for its primary energy consumption. In 2012, petroleum and other liquids accounted for an estimated 36% of the country's total energy used. The share of oil consumption has risen in the past few years as it supports the country's commodity production growth, mining, and petrochemical industry as well as the transportation sector.
Coal and natural gas account for 36% and 21% of the energy demand portfolio, respectively. Severe flooding in the state of Queensland in 2010 and 2011 affected coal production in the country, and the government has promoted policies to reduce coal consumption, particularly in the power sector, in favor of cleaner fuels. Renewable sources, including hydroelectricity, wind, solar, and biomass accounted for more than 6% of total consumption. Although the country is rich in uranium, Australia has no nuclear-powered electricity generation capacity and exports all of its uranium production.
Australia implemented a fixed-price tax on carbon dioxide emissions to be paid by the top emitting companies in July 2012 as part of the country's goal to reduce emissions by 5% in 2020 from 2000 levels. This tax was expected to lead to an increase in natural gas and renewable energy use, particularly in the electricity sector, and replace coal-fired power. In 2012, BREE projected that the shares of natural gas and renewables for primary energy consumption will increase to 34% and 14%, respectively, by 2050. However, the current government, which was elected in mid-2013, repealed the carbon tax legislation in July 2014 to remove the financial burden on industries required to pay for releasing emissions. This policy reversal is likely to allow coal to continue to hold a significant share of the energy consumption mix, particularly in the power sector. The reversal also may temper the expected pace of growth in renewable energy use as these sources are more expensive to develop than coal.
Petroleum and other liquids
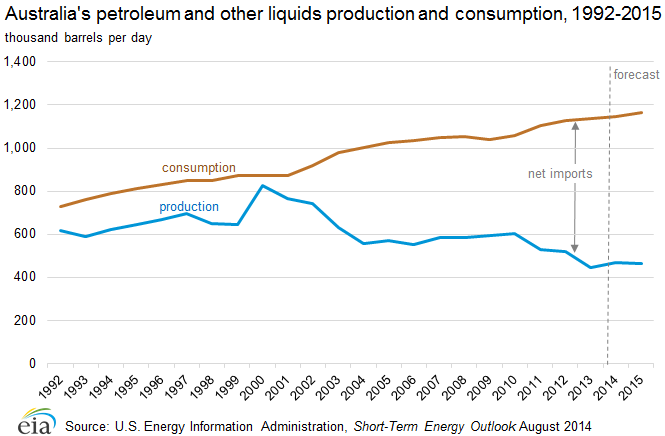
Australia's dependence on oil imports has increased to fill the growing gap between domestic consumption and production.
According to the Oil & Gas Journal (OGJ), Australia held more than 1.4 billion barrels of proved oil reserves as of January 1, 2014. Geoscience Australia reported economic reserves, which include proved and probable commercial reserves, of nearly 3.8 billion barrels, composed of 0.9 billion barrels crude oil, 1.9 billion barrels condensates, and 0.9 billion liquid petroleum gas (LPG) as of December 2012. Most Australian crude oil is a light, sweet grade, typically low in sulfur and wax, and therefore higher in value than the heavier crudes. The majority of reserves are located off the coasts of the states of Western Australia, Victoria, and the Northern Territory. Onshore basins, mostly found in the Cooper Basin, account for only 5% of the oil resources. Western Australia (including the Bonaparte Basin straddling Western Australia and Northern Territory) has 72% of the country's proven crude oil reserves, as well as 92% of its condensate and 79% of its LPG reserves. The two largest oil-producing basins are the Carnarvon Basin in northwestern Australia and the Gippsland Basin in southeastern Australia. Carnarvon Basin production, accounting for 61% of total liquids production in 2013, is mostly exported, and Gippsland Basin oil production, representing a 19% share in 2013, is predominantly refined for domestic use.
Although Australia is not producing oil shale (defined as sedimentary rock containing solid organic content, such as kerogen, and not equivalent to shale oil or tight oil) on a commercial basis, the country has resources of about 14 billion barrels of demonstrated or potential reserves (not economic or proved reserves), mostly located in Queensland, according to BREE. The majority of these reserves face technical and environmental challenges for commercial production. In 2008, Queensland's government issued a 20-year moratorium on oil shale mining at the McFarlane deposit and suspended other oil shale projects until the state reviews various technologies and environmentally safe methods of production. Queensland lifted bans on all production projects outside of the McFarlane deposit, but the state still reviews each project, applying strict environmental standards. Australia also holds shale oil or tight oil reserves, estimated to be around 18 billion barrels of technically recoverable reserves, located in various areas of Australia, according to a 2013 U.S. Energy Information Administration (EIA) study (Technically Recoverable Shale Oil and Shale Gas Resources) on world shale oil and natural gas resources.
Sector organization
Australia's management of oil exploration and production is divided between the states and the federal (Commonwealth) governments. Australia's states manage the applications for onshore exploration and production projects, while the Commonwealth shares jurisdiction over Australia's offshore projects with the adjacent state or territory. The Department of Resources, Energy and Tourism (RET) and the Ministerial Council on Energy (MCE) function as regulatory bodies over Australia's oil sector. As a result of the 2009 Montara field oil spill, Australia created a new offshore regulator to consolidate oversight for activity in this area in 2011. This new body, the National Offshore Petroleum Safety and Environmental Management Authority (NOPSEMA) oversees safety and the environmental performance of all offshore petroleum facilities.
International oil companies dominate the oil and natural gas exploration and development of Australia. Chevron is the largest foreign oil producer, supplying 96,000 barrels per day (bbl/d) in 2013. Other international oil companies actively investing in Australia's upstream hydrocarbon developments include Shell, ExxonMobil, ConocoPhillips, Inpex (Japan), Total, BHP Billiton, and Apache Energy. There are Australian companies, the largest being Woodside Petroleum and Santos that focus on upstream oil and gas developments. Other smaller domestic players in both the upstream and downstream markets include Origin Energy and Beach Energy.
In attempts to secure investment from international oil companies to develop many offshore blocks, Australia typically holds regular licensing rounds to release acreage for exploration each year. The 2011 round was the largest release held in a decade. The 2014 release offered 33 offshore blocks, including a second release of three blocks from the 2013 round, spanning four basins mostly in Western Australia and the Northern Territory. Western Australia held a separate licensing round in 2014 for five onshore blocks including those in the Canning Basin and in the Perth Basin, and the state of Queensland called for cash tenders for another six onshore areas. The 2013 offshore petroleum exploration acreage release included 31 blocks covering 6 basins, mostly in the offshore of Western Australia, the Northern Territory, and Victoria. As of June 2014, nine of the blocks were awarded.
Exploration and production
Australia's overall oil production has declined since 2000, although additions through condensate production and smaller crude oil developments are expected to offset declines in mature fields over the next few years.
Petroleum and other liquids production totaled 447,000 barrels per day (bbl/d) in 2013, of which about 44% consisted of crude oil, 31% lease condensates, and 14% liquid petroleum gas (LPG). The remaining 11% is from refining gains and biofuels. The share of crude in the total oil stream has declined over the past decade and has been gradually replaced by condensates and liquids associated with natural gas production. Australia's total liquids production peaked at 828,000 bbl/d in 2000 and has declined overall since then. According to the Australian Petroleum Production and Exploration Association (APPEA), liquid fuels production will continue to decline over the long term unless more fields are discovered and Australia is able to tap into more deepwater plays. Production from new, smaller offshore fields has not been able to offset declines from mature basins in the past several years. However, production additions from upcoming condensate and other smaller projects are expected to stem overall production declines over the next few years.
Australia's main frontier for oil exploration has moved in recent years to the deepwater area of the Timor Sea, although the nearby Carnarvon Basin and the Bonaparte Basin off the coast of Western Australia remain the busiest areas in terms of overall drilling activity. The offshore waters of Western Australia made up 69% of the total oil, condensate, and NGL production in 2012, according to APPEA. After a spike in drilling activity in the past decade, particularly in condensate fields, several significant discoveries are beginning production in these basins. The Gippsland Basin in the southern Victoria state still remains a significant source of oil production, comprising 18% of oil production in 2012, although production has declined since the 1980s.
A number of small offshore fields containing light and heavy sweet crude oil are under development and scheduled to come online by 2015. However, some of these fields are expected to have short lives of less than 10 years, signaling the need for greater offshore oil field development.
Condensate production, averaging about 140,000 bbl/d over the past several years, is a liquid fuel similar to light crude oil that is produced from natural gas fields. Production of condensate is expected to boost Australia's overall petroleum liquids production in the next few years. Several onshore and offshore LNG projects, some of which have condensate reserves, will support the country's natural gas exports by 2017. The Crux field in the eastern section of the Browse Basin could add about 36,000 bbl/d of liquids and process natural gas for the upcoming Prelude LNG terminal. Other fields such as Gorgon, Wheatstone, and Ichthys are expected to augment condensate production by 2018. Ichthys, a gas field heavy in condensates, could reach a peak production of 100,000 bbl/d by 2020. Altogether, these new LNG projects could boost condensate production by an estimated 200,000 bbl/d by 2020.
The Northwest Shelf Project (NWS), one of the world's largest liquefied natural gas projects, is a significant source of Australia's light oil, LPG, and condensate production. Output at some of the fields is declining, and Woodside, the operator, is attempting to prolong the production life of the Northwest Shelf oil fields beyond 2020 by developing the remaining 88.2 million barrels of proved and probable reserves. Woodside installed the Okha floating production, storage, and offloading (FPSO) facility in 2011 as part of an oil redevelopment project to replace the Cossack Pioneer FPSO.
Consumption
Australia's consumption of petroleum and other liquids has exceeded domestic production for several decades. Australia's petroleum consumption has risen modestly at about 2% per year since 2002, reaching more than 1.1 million bbl/d in 2013. The transportation sector is the country's largest oil consuming sector, consuming nearly 70% of the market share in 2013, according to Australia's BREE. Other key consumers are the manufacturing sector, the mining sector, the residential sector, and the agriculture sector. In the past few years, the country's focus on developing its vast hydrocarbon reserves and exporting energy commodities has boosted petroleum consumption required to operate remote mines and extract resources.
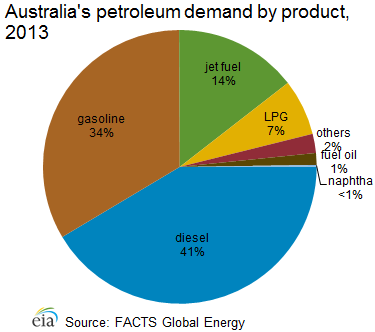
Diesel fuel holds the largest market share of refined oil product consumption (41%), according to FGE, and is used mostly for transportation and industrial purposes. Jet fuel consumption has also increased in the past several years as a result of rising air travel for commercial and tourism purposes.
Australia has a well-developed domestic oil pipeline network, which is privately owned and operated. Epic Energy operates a 400-mile pipeline that carries crude and natural gas liquids from Moomba to Stony Point. Santos operates two major domestic pipelines that are used for carrying oil and oil products, which include the Jackson to Brisbane line that spans 500 miles, and the Mereenie to Alice Springs line that covers 167 miles. Esso Australia Ltd. operates the 115-mile Longford to Long Island Point pipeline.
Oil trade
Australia is a net importer of both crude oil and oil products because its consumption of both energy sources exceeds overall production. In 2013, net crude oil imports were 253,000 bbl/d, and net product imports were 325,000 bbl/d, according to the Australia's Bureau of Statistics data. The country's northern and northwestern regions rely on oil product imports resulting from the lack of sufficient regional refining capacity, while the eastern side imports crude oil for its refineries and domestic markets. Singapore supplies about 47% of Australia's oil product imports, with the most of the remainder coming from refiners in Japan and South Korea. Most crude oil imports are from Malaysia, United Arab Emirates, and Indonesia, which altogether produced about 48% of the total imports in 2013. Another 20% of crude oil imports comes from West Africa, as Nigeria, Congo, and Gabon have increasingly supplied crude oil to Australia in recent years.
Because the majority of Australia's oil production is located off its Northwest coast away from its refineries in the East, Australia exports the bulk of its crude oil and condensates to other Asian refineries or to countries using direct crude burning in electric power plants such as Japan. According to the Australian Bureau of Statistics, in 2013, Australia exported 220,000 bbl/d of crude oil and condensates, sent primarily to Singapore, South Korea, China, Japan, Thailand, and Malaysia. Australia exports small quantities of oil products, mainly LPG.
Refining
According to FGE, Australia had 6 major refineries at the beginning of 2014, with a total crude oil refining capacity of 634,000 bbl/d operated by BP, ExxonMobil, Shell, and Caltex Australia. Scheduled refinery closures will reduce this capacity to 414,000 bbl/d by the end of 2015. Crude oil feedstock for these refineries comes from domestic oil produced in the Bass Strait offshore of southeastern Australia and from the country's crude oil imports. Refining throughput meets an estimated 56% of domestic demand, according to FGE. As refining capacity diminishes in Australia, this share will also decline as petroleum product imports increase.
Australia's refining margins have tightened, and the major refiners are taking financial losses as a result of increasing refinery competition within Asia, Australia's escalating labor and operating costs, stricter environmental standards on fuels, and higher prices of imported crude oil. Australia's refineries are small and dated compared to the larger and more complex refineries being built within Asia. These unfavorable economics have pressured operators to close several facilities and convert some of them to oil product import terminals. ExxonMobil closed its 80,000 bbl/d Adelaide refinery in 2003. Shell also shut down the 85,000 bbl/d Clyde refinery, located near Sydney, in late 2012, which had contributed to Australia becoming Asia's top diesel importer. Planned closures include Caltex's 125,000 bbl/d-Kurnell refinery located near Sydney by the end of 2014 and BP's Bulwer Island facility by mid-2015. Shell announced the sale of its 105,000 bbl/d-Geelong refinery to oil trading company Vitol in 2014, leaving the fate of this refinery uncertain. Overall, these refinery closures represent about half of the capacity in operation a decade ago, and these closures will likely lead to increases in the country's petroleum product imports, particularly for diesel, gasoline, and jet fuel.
Natural gas
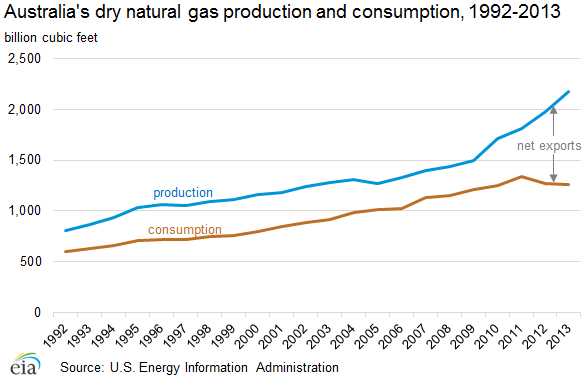
Australian natural gas production has increased sharply over the past decade as a result of new projects.
Australia produces enough natural gas to cover its consumption and to be considered a leading gas exporter. Several recent discoveries and growing regional demand for gas have spurred more investment activity in the country's reserves. Australia's natural gas reserves vary by industry source and the category of commercial viability. According to OGJ, Australia's proved natural gas reserves were more than 43 trillion cubic feet (Tcf) as of January 2014. Geoscience Australia estimated total proved plus probable commercial reserves at 132 Tcf (99 Tcf of traditional natural gas and 33 Tcf of coal bed methane-CBM) as of 2012. Most of the traditional gas resources (about 92%) are located in the North West Shelf (NWS) offshore in the Carnarvon, Browse, and Bonaparte basins.
CBM proved and probable resources, primarily located in the northeastern Queensland Province in the Bowen Basin and the Surat Basin, have doubled in the past three years to 33 Tcf in 2012. Geoscience Australia anticipates the resource distribution of natural gas will shift from the offshore traditional gas production to CBM or other sources in the next two decades as key CBM developers are aggressively exploring and drilling in several areas.
In addition to CBM resources, Australia had an estimated 437 Tcf of technically recoverable shale gas reserves in 2012, according to an EIA study. These resources are dispersed throughout the country in the inland Cooper Basin, the eastern Maryborough Basin, the offshore southwestern Perth Basin, and the northwestern Canning Basin.
Sector organization
The natural gas industry is regulated by the Department of Resources, Energy, and Tourism (RET) and the Ministerial Council of Energy (MCE). The MCE was created in 2001 to foster policy coordination between the Commonwealth and the state governments. The MCE functions as the national policy and governance body for Australia's energy market, and the group consists of ministers with responsibility for energy from the Australian government and all states and territories.
Major domestic and foreign companies operating in Australia include Santos, Woodside, Chevron, ConocoPhillips, ExxonMobil, Origin Energy, BG Group plc, Apache Corporation, INPEX Corporation, Total, Shell, and Statoil. Chevron holds the largest amount of natural gas resources in Australia, and the company has made 21 discoveries in the Carnarvon Basin since mid-2009, adding 10 Tcf to proved gas resources. The recent stream of CBM for LNG projects in Australia has also attracted Asian companies such as Sinopec, China National Offshore Oil Corporation (CNOOC), Tokyo Gas, and China National Petroleum Corporation (CNPC) that are interested in purchasing both LNG for markets in China and Japan as well as the upstream assets slated to supply these projects.
Exploration and production
Natural gas production in Australia reached nearly 2.2 Tcf in 2013 and has climbed overall from less than 1.2 Tcf in 2000 as a result of new developments. Traditional natural gas is largely produced in the Carnarvon Basin offshore Northwestern Australia, the Cooper/Eromanga Basin in central Australia, the Gippsland Basin in the southeastern Victoria Province, and the Bonaparte Basin in the offshore joint production area shared between Australia and East Timor. The Western Australia offshore region produced the largest share of total natural gas (58%) in 2012. The Carnarvon Basin supplied almost a third of the domestic natural gas market and the vast majority of the export market, according to APPEA. The Victorian state comprised about 18% of the total natural gas production. Queensland and New South Wales (NSW), Australia's main sources for coal bed methane, made up roughly 15% of natural gas production.
Many of Australia's new gas field developments are tied to liquefaction projects that have several export contracts in place. Several major new LNG projects are under construction or in advanced planning stages to support Asia's increasing appetite for natural gas.
The North West Shelf of Australia in the Carnarvon Basin holds some of the country's most mature and prolific fields that are the prime sources for the North West Shelf LNG terminal. As part of the North Rankin Redevelopment Project, the NWS Project developers are investing about $4.8 billion to recover remaining low-pressure gas from the North Rankin and Perseus gas fields. Also, a new production platform, North Rankin B, will be installed in 2013 to support production of smaller fields and extend their development until 2040. Also, the NWS project participants approved the first-phase development of the Greater Western Flank Project containing up to 3 Tcf of gas and 100 million barrels of recoverable condensate. The project is expected to start in 2016.
The Greater Gorgon fields, located approximately 100 miles off the northwest coast of Australia in the North Carnarvon Basin near Barrow Island, are collectively the country's largest known gas resource, and the Gorgon Project could encompass total reserves of 40 Tcf. The project, led by Chevron (50%), with Shell and ExxonMobil (25% each), is under construction and is on track to be completed in 2015. The project includes development of the Gorgon and Jansz-Io gas fields, with connection by subsea pipelines to Barrow Island, where LNG processing facilities will have production capacity of 750 MMcf/y. One of the project's key features is injecting the fields' carbon dioxide (CO2) into deep formations beneath Barrow Island to reduce overall greenhouse gas emissions. The project is expected to produce 950 billion cubic feet per year (Bcf/y) of natural gas and 20,000 bbl/d of condensate when completed.
Another major project under development neighboring the Gorgon Project is the Wheatstone Project that began construction in late 2011. When complete in 2016, the first two trains of its LNG export plant are expected to export 430 Bcf/y. Maximum production from the project is anticipated at 584 Bcf/y of natural gas and 30,000 bbl/d of condensate.
The first stage of the Pluto Project near Karratha, offshore Western Australia, came online in March 2012 with estimated LNG capacity of 200 Bcf/y. Woodside Energy owns 90% of the venture supported by 15-year sales contracts with Kansai Electric and Tokyo Gas, which hold 5% equity each. The Pluto project includes an offshore platform connecting five subsea wells and a 112-mile pipeline to an onshore LNG facility on the Burrup Peninsula. Plans for a second train are on hold while project owners seek additional gas supply.
The Browse Basin Development Program is another key area of gas discoveries in offshore northern Australia. The largest field in the basin, Ichthys, holds 12.8 Tcf of gas and 530 million barrels of condensate reserves. Construction on this field began in 2012. The project is led by Japan's INPEX (66%) and Total (30%). A 552-mile undersea pipeline will connect the fields to a new export LNG terminal to be built near Darwin. When the project becomes operational in 2017, its production is expected to be 400 Bcf/y of LNG, 100,000 bbl/d of condensate, and 32,000 bbl/d of LPG. Other smaller fields under development in Browse are Crux and Prelude. The partners developing Crux received a five-year retention lease in 2013 and continue to discuss gas processing options, such as constructing a designated stand-alone floating LNG terminal or supplying gas to other projects such as Shell's planned Prelude LNG floating terminal.
The Bonaparte Basin in the Timor Sea straddles the waters of Australia and East Timor and holds some undeveloped gas resources. ConocoPhillips is currently drilling fields at the Bayu Undan natural gas and condensate field. The Greater Sunrise field is a new development that has estimated resources of more than 5 Tcf of gas and 230 million barrels of condensates.
Coal bed methane and shale gas
Australia has
sizeable, untapped natural gas resources in the form of coalbed methane
(CBM), known as coal seam gas in Australia, and shale gas. Australian
officials estimate that economically recoverable CBM reserves in 2012 were
33 Tcf, mostly contained in the Surat Basin and Bowen Basin in Queensland.
Commercial production from CBM began in 1996 and totaled 246 Bcf in 2012,
accounting for almost 13% of total natural gas production, according to
BREE.
Many CBM projects are still being explored, and production is not targeted for another few years. Investors face challenges with project delays based on greater public resistance to potential environmental impacts. Australia is attempting to balance its dual interests of increasing investment and exploitation of these resources as well as developing them in a sustainable and environmentally safe way. NSW, Queensland, and the federal government have increased environmental regulations, particularly those related to water use and disposal and land rights in CBM and shale gas projects. Queensland established more austere water safety and management policies for CBM producers. In 2012, NSW replaced the moratorium it imposed in 2011 on hydraulic fracturing with a Strategic Regional Land Use Policy that restricts CBM production near residential areas and small industries. South Australia, which houses part of the Cooper Basin, was the first province to publish extensive guidelines for gas development. The guidelines intend to encourage investment and development of these projects while outlining environmentally safe extraction practices.
Shale gas reserves in Australia are vast and could boost gas production once developed. As noted above, EIA estimates in a recent report that Australia has 437 Tcf of technically recoverable reserves, ranking the country sixth highest in the world, behind Russia, the United States, China, Argentina, and Libya. Most of the exploration activity has focused on the Cooper Basin in the interior of the country where the majority of the country's onshore traditional gas reserves are located. The basin has attracted many international oil companies with the financing and technical capacities to develop the shale reserves as well as many mid sized companies. Santos drilled the first successful commercial shale gas flow at its Moomba field in the Cooper basin at the end of 2012. In 2013, the South Australian regional government created regulatory guidelines of field development in order to provide transparency and recommendations for the industry to tap into the shale gas reserves.
Consumption
Even though Australia has experienced a steady rise in domestic natural gas consumption over the past decade, the market for domestic consumption of natural gas in Australia is somewhat limited. However, the government is interested in reducing carbon dioxide emissions through the use of cleaner fuels such as natural gas and renewables. Australia consumed less than 1.3 Tcf of natural gas in 2013, steadily rising about 37% over the past decade. On average, domestic markets consume a majority of the production. Since 2009, the gap between supply and domestic demand began widening as LNG sales expanded. Australia's industries are the major consumers of natural gas, with a 32% market share in 2012, according to government data. The second-largest consumer is the power sector, accounting for 31%. The mining sector accounted for 19%, and the residential sector's share was 11%.
Natural gas prices in the domestic market have been low compared to international rates. However, rising LNG exports have created various supply-side cost pressures especially in the eastern states. As natural gas contracts expire, suppliers are raising prices to reflect the netback of global LNG markets. Rising gas prices could place downward pressure on consumption growth, especially from the power and manufacturing sectors, as some companies seek alternative fuel sources or cost reductions.
Australia implemented a carbon tax in July 2012 that was expected to shift more electricity generation from the coal-fired to cleaner burning gas-fired facilities. However, Australia's new government, elected in September 2013, repealed the carbon tax and emissions trading scheme in July 2014 in attempts to lower electricity and natural gas prices for domestic consumers, particularly industries, as well as to reduce the financial burden on companies that are top emitters. This policy change could temper domestic natural gas demand growth, especially in the power sector, in favor of lower-cost baseload coal generation.
LNG exports
Australia has become a leading LNG exporter in the Asia-Pacific region in the past decade. Greater expected natural gas production and new LNG capacity in the next few years is likely to boost natural gas exports even more.
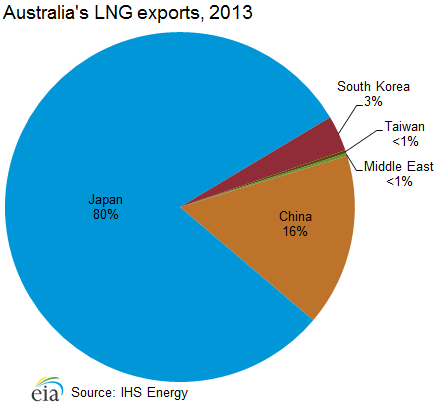
As a result of its abundant gas resources and its geographic proximity to consumer markets, Australia has become a leader of LNG supply for the Pacific basin. Over the past decade, Australian LNG exports have increased nearly three times, and they are expected to rise substantially in the medium term as developers usher in new upstream and liquefaction capacity. Australia, the third-largest LNG exporter in the world behind Qatar and Malaysia, exported 1,070 Bcf of LNG in 2013, up from about 990 Bcf in 2012, according to IHS Energy. Australia exports natural gas almost exclusively to Asian markets, with Japan purchasing about 80% of Australia's exports in 2013, mostly through long-term contracts. Other key consumers include China, South Korea, and Taiwan. Japan's demand for LNG rose in 2011 when natural gas-fired generation was substituted for the lost nuclear capacity following the Fukushima power plant accident. Australia became the largest source of LNG for Japan by 2012. Chinese national oil companies (NOCs) have teamed with international oil companies (IOCs) on investments in several Australian liquefaction projects and signed gas purchase agreements to lock in supply for the growing market in China.
Australia has three LNG export facilities with a total capacity of almost 1.2 Tcf per year. The largest is North West Shelf LNG, owned and operated by a consortium of Woodside, Shell, BP, Chevron, Japan Australia LNG, and BHP Billiton. The facility has five offshore LNG trains with a total capacity of 780 Bcf/y, and it relies on natural gas supplied from nearby fields in the North West Shelf (NWS). The majority of LNG produced by the consortium is exported to Japan by long-term contracts. Darwin LNG, operated by the consortium of ConocoPhillips, Santos, Eni, INPEX, Tokyo Gas, and Tokyo Electric (TEPCO) is Australia's second facility. It has one production train with capacity of 170 Bcf/y and exports LNG under contracts to Tokyo Gas and Tokyo Electric. Darwin, located on Australia's northern coast, is supplied with natural gas from the Bayu-Undan field in the Timor Sea. Pluto LNG is Australia's most recent terminal to come online in 2012. Located in the Northwest region, Pluto LNG has a capacity of more than 200 Bcf/y. Woodside is discussing expansion plans for Pluto LNG, but difficulties procuring additional gas reserves nearby and rising project costs pose challenges to the expansion moving forward.
As new LNG facilities and expansions of existing facilities come online within the next decade, Australia's LNG export capacity is set to expand substantially. Most of the liquefaction projects are located in the coastal or offshore northwestern Australia and in the northeastern Queensland region. Some projects such as Ichthys are designed to produce associated condensates and LPG. Currently, there are 7 projects under construction with a total capacity of 3 Tcf/y, 3 in Queensland and 4 in the basins of the northwest coast and offshore. These projects are scheduled to commence operations by 2017. Other projects are waiting on regulatory approval or final investment decisions, although these projects are facing competition and delays because of escalating costs and potential overcapacity for the amount of available natural gas supply. Australia currently has more than $190 billion worth of LNG projects under construction, and the country is on target to overtake Qatar as the world's largest LNG exporter by 2020, according to industry sources.
CBM-to-LNG projects have become feasible with the sizeable amount of gas reserves associated with the coal production. Queensland Curtis LNG could become the world's first LNG project of this kind, with two neighboring projects under construction and two other projects waiting on final investment decisions. Even though many companies are leveraging the vast CBM resources in Queensland to convert the fuel to LNG, CBM projects pose unique challenges to production. There are typically more hurdles for environmental approval. Also, CBM wells produce much less than traditional gas wells and ramp up to peak production over a much longer period, according to PFC Energy.
Australia's burgeoning LNG industry faces acute capital cost escalation requiring much larger investments for new greenfield projects and has delayed or cancelled some proposed projects. According to FGE and IHS Energy, cost increases are attributed to a number of factors such as labor shortages and resultant high wages, high material costs and changes in engineering requirements, appreciation of the Australian dollar to the U.S. dollar between 2009 and 2013, greater environmental hurdles because of more strict regulations, land rights issues, and the remote locations of some projects. Several projects have experienced notable cost inflation such as Ichthys, Gorgon, Wheatstone, Gladstone, and Queensland Curtis. Pluto LNG also incurred budget overruns by 30% from its original financial investment decision (FID) in 2007. Ichthys LNG, sanctioned in 2012, is currently the world's most expensive liquefaction project on a per unit basis, and Chevron's Gorgon LNG project cited cost increases of 46% in U.S. dollar terms since the project's final investment decision, from $37 billion to $54 billion.
Some of the economic and resource constraints have caused several equity partners to prioritize and reduce their project portfolio stakes and even exit some projects. Also, some neighboring projects face competition with each other for contracted gas supply and limited natural gas production especially in the eastern part of Australia. In Australia's high-cost environment, international companies are beginning to target their investments towards projects in more advanced stages and could shift focus to the expansion of existing facilities or projects currently under construction versus new projects in the planning phase. In 2014, Shell sold its 6.4% stake in the Wheatstone LNG project to partner, KUFPEC, a Kuwaiti company and decided to delay project development for Arrow LNG. As less expensive natural gas from Russia, the United States, and Africa is brought online and exported, Australia faces global LNG supply competition for projects that are not currently under construction.
To reduce project costs and to liquefy gas from fields that are far from shore, companies are turning to the floating liquefied natural gas (FLNG) terminal design, which is less expensive than the cost of an onshore plant. Prelude LNG, located in the Browse Basin off the northwest coast, is slated to become the world's first FLNG terminal by 2017 by using a new technology developed by Shell. Woodside decided to convert Browse LNG from a land-based terminal to a floating terminal in 2013 to reduce the massive project costs. Gaz de France and Santos cancelled the Bonaparte LNG project in 2014. Despite the FLNG design of Bonaparte LNG, the companies determined that the rates of return on investment were too low based on the project's rising costs and small gas resource base. Natural gas from the fields may be able to feed other more advanced LNG projects or piped to the domestic market.
| Project name | Companies | Peak output (Bcf/y) | Target start year | Capital cost |
|---|---|---|---|---|
| Existing LNG terminals | ||||
| Northwest Shelf LNG | Woodside, Shell, BHP Billiton, BP, Chevron, Mitsubishi & Mitsui - 16.7% each | 780; 5 trains1 | Operational | $11.5 billion for T1-3; $3.5 billion for T4; $6.5 billion for T5 |
| Darwin LNG | ConocoPhillips 57.2%, Santos 11.4%, Inpex 11.3%, Eni 11%, Tepco 6%, Tokyo Gas 3% | 170; 1 train | Operational | $3.84 billion |
| Pluto LNG | Woodside 90%, Kansai Electric 5%, Tokyo Gas 5% | 206; 1 train | Operational | $14 billion |
| Projects under construction | ||||
| Queensland Curtis LNG (CBM) | T1: BG 50%, CNOOC 50%; T2: BG 97.5%, Tokyo Gas 2.5% | 400; 2 trains | Q4 2014 | $20.4 billion |
| Australia Pacific LNG (CBM) | Origin Energy 37.5%, ConocoPhillips 37.5%, Sinopec 25% | 430; 2 trains | Q3 2015 | $25.5 billion |
| Gorgon LNG | Chevron 47.33%, ExxonMobil 25%, Shell 25%, Japanese gas & electric utilities 2.667% | 750; 3 trains | Q3 2015 | $54 billion |
| Gladstone LNG (CBM) | Santos 30%, Petronas 27.5%, Total 27.5%, Kogas 15% | 375; 2 trains | Q4 2015 | $18.5 billion |
| Wheatstone LNG | Chevron 64.14%, Apache 13% (announced plans to sell its share in July 2014), KUFPEC (Kuwait) 13.4%, Japanese gas & electric utilities 9.455% | 430; 2 trains | Q1 2016 | $29 billion |
| Ichthys LNG | INPEX 63.45%, Total 30%, CPC 2.63%, Japanese gas & electric utilities 3.94% | 400; 2 trains | 5Q4 2016 | $32 billion |
| Prelude LNG | Shell 67.5%, Inpex 17.5%, Kogas 10%, CPC 5% | 175; 1 floating terminal2 | Q1 2017 | $11.4 billion |
| Planned projects | ||||
| Fisherman's Landing (CBM) | LNG Ltd 81.11%, CNPC subsidiary 19.89% | 144; 2 trains | Originally 2016; Delayed | $1.7 billion |
| Arrow LNG (CBM) | Shell 50%, PetroChina 50% | 384; 2 trains in Phase I | 2018; EIS plan submitted; FID delayed | $24.2 billion |
| Cash Maple LNG | PTTEP (Thailand) 100% | 100; 1 floating terminal | On hold; 2019 | N/A |
| Browse LNG | Woodside 31.23%, Shell 26.63%, BP 17.21%, PetroChina 10.23%, Mitsui 7.35%, Mitsubishi 7.35% | 560; 3 floating terminals | 2020; FID expected Q4 2015. | $40-56 billion |
| Scarborough LNG | BHP Billiton 50%, ExxonMobil 50% (operator) | 300; 1 floating terminal | 2020/21; FID anticipated 2015 | N/A |
| Sunrise LNG (Joint Development Area- Australia and Timor-Leste) | Woodside 33.44%, ConocoPhillips 30%, Shell 26.56%, Osaka Gas 10% | 192; 1 floating terminal | To be determined | $5 billion |
| 1 A train is an independent unit for
liquefaction and purification. 2 A floating terminal is one above an offshore gas field that produces, liquefies, stores, and transfers natural gas. Sources: IHS Global Insight, FACTS Global Energy, International Energy Agency, company websites |
||||
Pipelines
Australia's domestic gas transmission pipeline network, covering 15,000 miles, is well developed and transports gas from the key production centers to main economic hubs in the east. Significant investments since 2000 have expanded the gas network. The pipeline system interconnects all states except Western Australia and the Northern Territory because of their remote locations. Some pipelines transport gas from the country's inland fields to Darwin, Sydney, and the southeastern coast. In Western Australia, there are three major pipelines that transport gas from northwestern gas fields to the southwestern region. Rising natural gas prices in Australia, particularly in the eastern region, and investments for new exploration and development of various basins around the country are compelling the country to further its gas pipeline integration. The APA Group (APA), Australia's largest pipeline operator, proposed an interconnector to link the Northern Territory to one of the major pipelines that serve demand in eastern Australia. A completely integrated system would optimize natural gas transit to meet domestic demand and LNG export obligations.
The Australian Energy Regulator oversees the gas pipeline networks in all states with the exception of Western Australia, which is regulated by the Economic Regulation Authority.
However, the transmission and distribution network is largely privately-owned and operated, and several major pipelines are only partly regulated or not regulated.
APA operates 8,400 miles of pipeline and transports about half of the country's natural gas. In 2012, APA acquired Hastings Diversified Utilities Fund (owner of Epic Energy) making the operator the country's majority stakeholder of transmission capacity. Other key pipeline owners include Jemena, Prime Infrastructure, and Australian Gas Light.
Coal
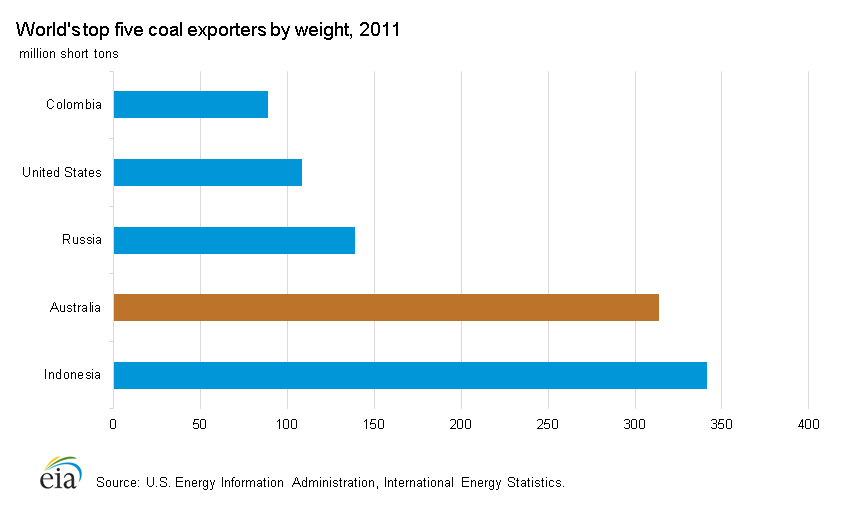
Australia is the world's second-largest exporter on a weight-basis, and coal ranks as the second-largest export commodity for Australia in terms of revenues. It holds the fourth-largest reserves.
Australia is one of the key sources of coal in the world, and the commodity plays a significant role in the country's economy. At the end of 2011, Australia held 84 billion short tons (Bst) of recoverable coal reserves, the fourth-largest in the world behind the United States, Russia, and China, according to the World Energy Council 2013 Survey. The Australian government estimates proved and probable commercial reserves at 116 billion short tons in 2012, with about 58% coming from black coal and 42% from brown coal. For 25 years, Australia was the largest coal exporter, but in 2011 Indonesia surpassed Australia in terms of coal exports on a weight-basis. Black coal, primarily bituminous or anthracite coal, is Australia's second-largest export commodity, behind iron ore, in terms of revenues. Australia exported about $40 billion worth of coal in 2012, according to the Minerals Council of Australia.
Australian coal is chiefly bituminous or sub bituminous (from black coal) in rank. Together, the states of Queensland and NSW accounted for 98% of Australia's black coal production in 2012, and Victoria accounted for virtually all of the brown coal reserves and production. Black coal contains a high energy content and is typically exported. Brown coal, or lignite, is used largely for domestic electricity generation.
Sector organization
In 2012, Australia had approximately 120 privately-owned coal mines located throughout the country, according to the International Energy Agency (IEA). A majority of Australia's coal production comes from open pit operations, with the remainder coming from underground mines. International companies such as BHP Billiton, Anglo American (UK), Rio Tinto (Australia-UK), and Xstrata (Switzerland) play a significant role in Australia's coal industry.
Production and consumption
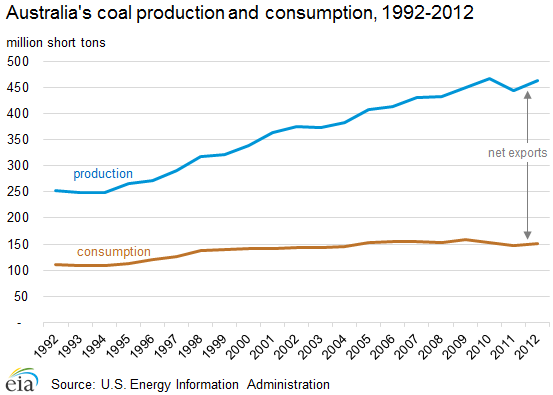
In 2012, Australia produced 464 million short tons (MMst) of coal, slightly down from 468 MMst in 2010. The decline in 2011 production was primarily a result of the flooding in Queensland that occurred in early 2011 and lowered production in that state by 30%. During the past two decades, coal production in Australia has grown by 84%, with new projects continuing to come online every year, and BREE estimates indicates continued growth in production during 2013. This growth has been supported by strong regional demand and by continued investment in new mining and export capacity. As of April 2014, Australia had $11.2 billion in advanced coal mining and infrastructure projects to add nearly 80 MMst to production capacity by 2017, according to BREE.
Coal plays a major role in meeting domestic energy needs, accounting for approximately 64% of Australian electricity generation according to BREE. Coal consumption has been relatively flat for more than a decade as Australia's electricity use has not increased much. Although in recent years, Australia has focused on substituting some coal-fired generation with natural gas and renewable power and overall coal use has declined from a high of 158 MMst in 2009, coal remains a baseload source for power because of the country's abundant resources and sophisticated infrastructure. The future of coal in the country's power generation will depend on policies and on the cost of coal relative to other sources of generation. Australia is also focused on increasing exports to satisfy higher energy demands throughout Asia.
Exports
Australia exported about 72% of its coal production, or about 332 MMst in 2012. The country was the world's largest coal exporter for more than two decades, and fell behind Indonesia on a weight-basis in 2011. According to the Australian Bureau of Statistics, Japan was the destination for nearly 35% of Australia's coal exports in 2013. China, Australia's second-largest market for exported coal, held a 25% share and more than doubled its export levels from the two years prior. Other top markets included South Korea (14%), India (11%), and Taiwan (9%). Most exports are from the Queensland and NSW states, although Western Australia began exporting coal in 2007.
Coal exports are serviced by nine major coal ports and export terminals located in Queensland and NSW. In 2012, these terminals had a combined handling capacity of 510 MMst. Several new port infrastructure projects are in various stages of development and are expected to add about 56 MMst to annual coal loading capacity by 2016. These include Wiggins Island, the third capacity expansion by Newcastle Coal Infrastructure Group's at the Port of Newcastle, and the expansion at Hay Point in Queensland.
Electricity
Although about 87% of Australia's electric generation in 2013 was from fossil fuels, chiefly coal, there is a push for cleaner and more renewable power.
Australia's electricity generation has gradually risen over the past two decades as a result of a well-developed economy and growing mining sector. Between 2000 and 2013, electric generation increased from around 200 billion kilowatthours (kWh) to 250 billion kWh, according to BREE data. However, generation has been relatively flat in recent years, with consumption being held in check by higher electricity costs, weaker economic growth, and energy efficiency gains.
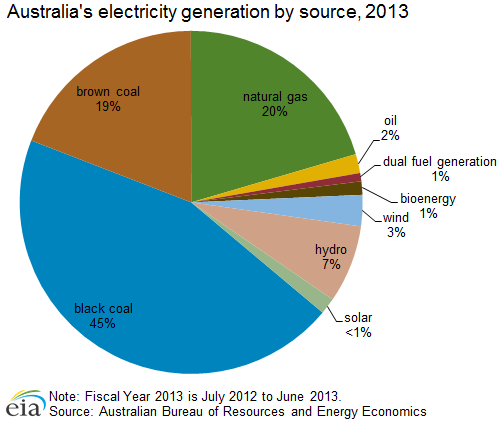
Australia's electricity generation is mostly from fossil fuels, with total coal making up 64% of electric power generation in 2013, according to BREE. The use of coal-fired generation rose until 2009 and has yielded some share to natural gas, hydroelectric, and other renewable energy in the past few years. Natural gas-powered generation is mostly used for intermediate and peak demand times and supplied 20% of total electricity generation. BREE projects that natural gas will gain further market share and account for 36% of electric generation by 2050. Gas-fired generation capacity is highest in Queensland, and over the past decade, investment has increased in gas-fired capacity in the country.
Hydroelectricity, accounting for 7% of total electricity generation in 2013, occurs in the states of Tasmania, Victoria, and NSW. Hydroelectricity is Australia's major source of renewable energy, although it has limited growth potential because of water availability constraints. Also, the country's hydropower market is fairly extensive, and there are opportunities mainly just for small projects.
Although other renewable sources, such as wind, bioenergy, and solar, supplied just 6% of electricity in 2013, they have been the fastest-growing renewable sources since 2000. Wind energy has seen substantial growth since 2007 and accounted for more than 50% of other renewable sources in 2013. Although accounting for a small portion of the renewable energy generation, solar power experienced the most growth during the past year as a result of the government's promotion of small-scale renewable energy projects and off-grid residential solar use. As part of Australia's Renewable Energy Target introduced in 2010, the government targets a 20% share of electricity demand must be met by renewable energy sources by 2020.
Australia's electricity grid is well established in the eastern and southern states under the National Electricity Market (NEM), a wholesale market that connects five Australian states and the Australian Capital Territory. The NEM infrastructure is owned by a mixture of state-level governments and the private sector. Western Australia and the Northern Territory have separate transmission networks from the other states.
Electricity prices in Australia used to be much lower until a few years ago, and now the country's retail prices are comparable to some of the highest electricity rates in developed countries. Between 2008 and 2012, consumer electricity prices rose by nearly 60%, according to a report for Australia's Climate Change Authority. This increase was necessary to finance infrastructure upgrades and investment in system reliability as well as support renewable energy tariff programs. According to AER, the rate of overall electricity price increases has slowed considerably for most states, apart from the tariffs in Queensland where electricity prices were 20% higher in 2013.
Notes
- Data presented in the text are the most recent available as of August 28, 2014.
- Data are EIA estimates unless otherwise noted.
Sources
AAP Newsfeed
APA Group (APA)
Asia Pulse
Australian Bureau of Agriculture and Resource Economics (ABARE)
Australian Bureau of Resources and Energy Economics (BREE)
Australian Bureau of Statistics (ABS)
Australian Department of Foreign Affairs and Trade (DFAT)
Australian Department of Resources, Energy and Tourism (RET)
Australian Energy Regulator (AER)
Australian Petroleum Production and Exploration Association Ltd. (APPEA)
Chevron
Energy Intelligence Finance
FACTS Global Energy
Geoscience Australia
IHS Energy
Minerals Council of Australia
Newsbase Asian Oil
Offshore Technology
PFC Energy
Platt's Oilgram News
Reuters
Rigzone News
Santos
The Australian
Townsville Bulletin
U.S. Energy Information Administration
Woodside Energy